BTC/USD Long Setup – Bullish Reversal PlayAfter a sharp drop, BTC is testing a key liquidity zone around 78.2k. The market structure suggests a potential bullish reversal, with a fakeout and recovery in sight.
📌 Trade Idea:
Entry: After confirmation of a reclaim and bullish structure break (above ~79.3k)
SL: Below recent low ~77.6k
TP: 82.8k zone
RRR: ~3.2
📅 Timeframe: 30min
📈 Bias: Counter-trend long
🔁 Watch for: Price reaction at current support and market structure shift
🚨 Wait for confirmation – patience is key in volatile conditions!
Cryptotrading

Trading opportunity for MNTUSDTBased on technical factors there is a Sell position in :
📊 MNTUSDT
🔴 Sell Now
🪫Stop loss 0.8860
🔋Target 0.7000
📏 R/R 1,8
💸RISK : 1%
We hope it is profitable for you ❤️
Please support our activity with your likes👍 and comments📝

Trading opportunity for API3USDTBased on technical factors there is a Sell position in :
📊 API3USDT
🔴 Sell Now
🪫Stop loss 1.250
🔋Target 0.820
📏 R/R 1,5
💸RISK : 1%
We hope it is profitable for you ❤️
Please support our activity with your likes👍 and comments📝

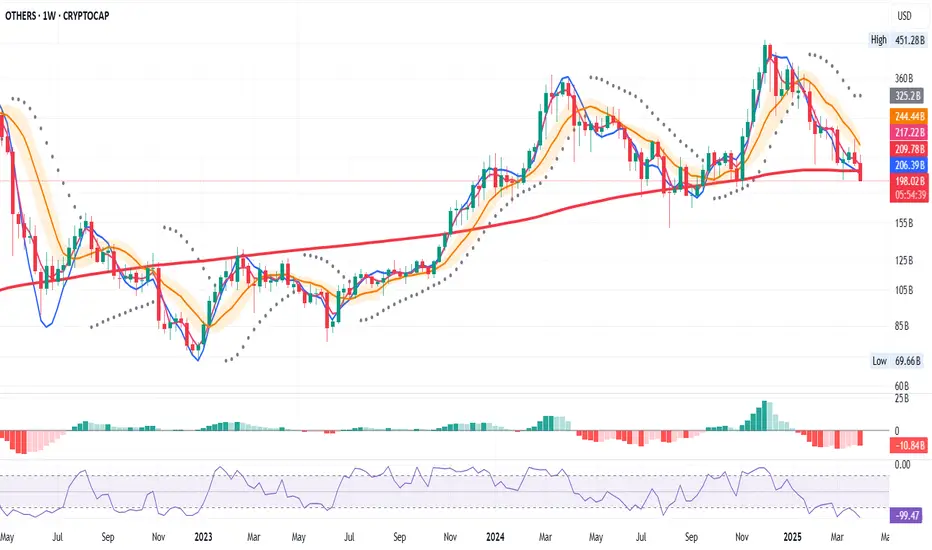
OTHERS Weekly – Testing Critical Support 200MA
The altcoin market is in a fragile state. On the weekly, OTHERS is about to close below the 200 MA—a key structural level. Meanwhile, the system remains fully bearish:
- LR < SMA < BB center
- PSAR above price
- No setup, no trade
This is where discipline saves capital. It’s easy to feel urgency when the chart looks rough, but reacting emotionally only leads to losses. Even now, I remind myself: structure first, sentiment second. When rules align, I’ll act. Until then, I protect capital, not pride.
Most of trading is waiting. The rest is having the mindset to know why.
BTC Weekly – System Says Wait
BTC closed above the 200 MA — structurally bullish.
But the system remains bearish:
LR < SMA < BB center
PSAR dots above price
No setup confirmed. No rule = no trade.
After a macro-heavy week, BTC is holding, but that can flip fast.
This is where discipline protects you.
You can have the best system, but without the right mindset, it won’t help you.
Discipline is more than following rules — it’s about being in the right state to trust them.
I don’t predict. I follow.
The system keeps me calm, focused, and out of emotional trades.

#FILUSDT remains under bearish pressure📉 SHORT BYBIT:FILUSDT.P from $2.616
🛡 Stop loss $2.645
🕒 1H Timeframe
⚡️ Overview:
➡️ The POC (Point of Control) BYBIT:FILUSDT.P is located at $2.766, far above the current price — this highlights strong historical selling pressure.
➡️ Price is forming lower highs and lower lows, confirming a bearish trend.
➡️ The breakdown below $2.616 triggered the short setup with further downside potential.
➡️ Volume spikes during red candles indicate continued seller activity.
🎯 TP Targets:
💎 TP 1: $2.605
💎 TP 2: $2.584
💎 TP 3: $2.570
📢 Watch the $2.616 zone — holding below increases downside probability.
📢 If price moves above $2.645, the setup becomes invalid.
BYBIT:FILUSDT.P remains under bearish pressure — short bias stays valid under current structure.

ZROUSDT – Short SetupI'm taking a short position on #ZROUSDT after a Break of Structure (BOS) confirmed a shift in market direction, following a Change of Character (Choch).
Price retraced into the 15-minute Fair Value Gap (FVG) and tapped into the premium zone near the 0.5–0.618 Fibonacci level, offering a good entry for a short setup.
Entry: Around 2.98
Stop Loss: Above 3.07
Target: 2.88 - 2.8 - 2.67
Risk/Reward Ratio: 1:3.4
Waiting for follow-through to the downside. Trade safe and always manage your risk.

Bitcoin (BTC/USD) – Bearish Breakdown & Key Levels to WatchMarket Overview:
Bitcoin is trading at $84,185, showing a +1.63% increase. The price action suggests a potential breakout towards the upside.
🔹 Chart Structure:
BTC has been consolidating in a range-bound structure after a sharp upward move.
Previous rising wedge patterns led to corrections, but the price is holding key support levels.
A breakout setup is forming with a target towards $88,500 – $90,000.
🔹 Key Levels to Watch:
✅ Resistance: $85,249, $86,934, $88,500, $90,000
✅ Support: $82,000, $81,400
🔹 Potential Trade Setup:
📈 Bullish Scenario:
If BTC holds above $84,000, a push towards $86,500 – $88,500 is likely.
A breakout above $88,500 could lead to $90,000+.
📉 Bearish Scenario:
If BTC rejects $85,000, a pullback to $82,000 – $81,400 may occur before another move up.
🔹 Conclusion:
Bias: Bullish above $84,000
Target: $88,500 – $90,000
Invalidation: Below $81,400
Would you like a more detailed trade plan with stop-loss and entry points? 🚀

BTCUSD: Conservative September Target $150kBitcoin remains neutral on its 1W technical outlook (RSI = 46.307, MACD = 1999.100, ADX = 44.501), firmly supported on top of the 1W MA50. On this analysis you see the Channel Up that dictated the price action of the last three Cycles. Since December 2023 BTC has traded solely inside the 0.382 - 0.618 Fibonacci Zone, the median zone of the Channel Up. The Theory of pre-Halving / post-Halving symmetry implies that the time range from the Cycle Bottom to the Halving is almost the same as the time from the Halving to the Cycle Top. Since on the current Cycle, the time from the Bottom to the Halving has been 76 weeks, in theory the Top should be another 76 weeks from the Halving. We take the worst case estimate of 74 weeks like the 2017 Top. That's the end of September. And with regards to the target, a conservative estimate is just over the 0.5 Fib at 150k, like the highs of December 2024 and March 2024.
## If you like our free content follow our profile to get more daily ideas. ##
## Comments and likes are greatly appreciated. ##

ATOMUSD: Channel Down bottomed. Strong buy signal.Cosmos turned bullish on its 1D technical outlook (RSI = 60.498, MACD = 0.008, ADX = 27.015), which raised 1W to a neutral state. This is perfectly aligned with the market structure at the moment, which is a technical rebound at the bottom of the 3 year Channel Down. The 1W RSI is on a HL trendline, which is a bullish divergence as far as the Channel's LL are concerned. This means that there is potential to break this Channel to the upside, but until this happens, we will be targeting the 0.786 Fibonacci retracement level (TP = 9.500), like the previous bullish wave did.
## If you like our free content follow our profile to get more daily ideas. ##
## Comments and likes are greatly appreciated. ##

BTC ANALYSIS 🔮 #BTC Analysis 🚀🚀
💲💲 #BTC is trading between support and resistance area. There is a potential rejection again from its resistance zone and pullback from its major support area. If #BTC breaks resistance zone $88500 then there will a chance of bullish movement
💸Current Price -- $84470
⁉️ What to do?
- We have marked crucial levels in the chart . We can trade according to the chart and make some profits. 🚀💸
#BTC #Cryptocurrency #DYOR

Trading opportunity for TELUSDTBased on technical factors there is a Buy position in :
📊 TELUSDT
🔵 Buy Now
🪫Stop loss 0.004400
🔋Target 0.006600
📏 R/R 2
💸RISK : 1%
We hope it is profitable for you ❤️
Please support our activity with your likes👍 and comments📝

Trading opportunity for KAVAUSDTBased on technical factors there is a Sell position in :
📊 KAVAUSDT
🔴 Sell Now
🪫Stop loss 0.4315
🔋Target 0.3300
📏 R/R 2
💸RISK : 1%
We hope it is profitable for you ❤️
Please support our activity with your likes👍 and comments📝

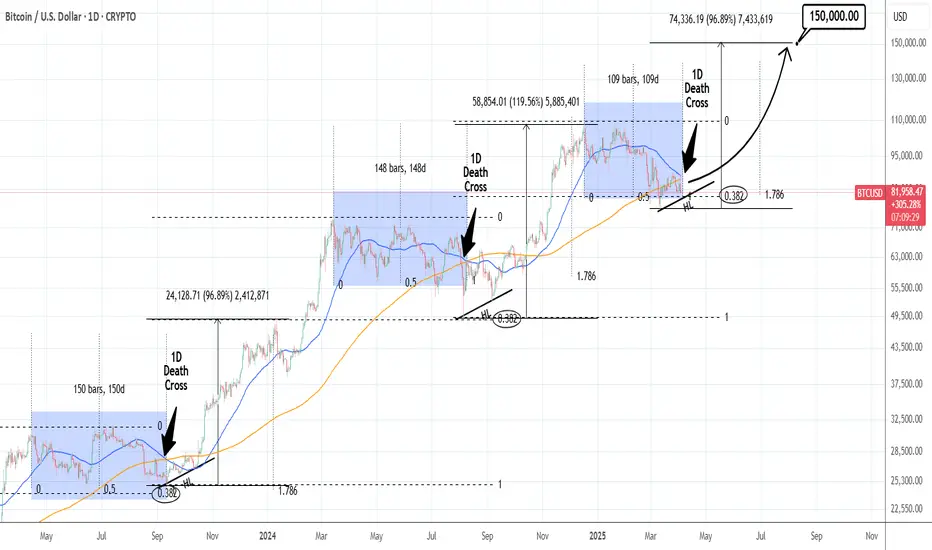
BTCUSD: 1D Death Cross can push it to $150k by August.Bitcoin turned bearish again on its 1D technical outlook (RSI = 43.071, MACD = -1375.000, ADX = 26.965) showcasing the high volatility that yesterday's tariffs announcement inflicted. 1W remains marginally neutral though (RSI = 45.519), highlighting the long term buy opportunity the current levels present.
The market is about to form the first 1D Death Cross, which occurs when the 1D MA50 crosses under the 1D MA200, since August 9th 2024. Even though that's technically a bearish formation, it has worked only as a bottom market during the current Bull Cycle. Both the Aug 9th 2024 and September 11th 2023 1D Death Crosses were formed exactly when BTC bottomed. In symmetric fashion the first two were formed 150 days after the previous high and rose by at least +96.86% by the 1.786 Time Fibonacci extension. Also both bottoms held the 0.382 Fibonacci retracement level.
This time the 1D Death Cross will be formed approximately 109 days after the previous high, which means that this phase is more aggressive than the others and may equally be more aggresive on the bullish wave too. Still, if it 'just' repeats the previous ones, we estimate to reach $150,000 by this August.
## If you like our free content follow our profile to get more daily ideas. ##
## Comments and likes are greatly appreciated. ##
The Power of a Trading System with the Right Mental State
📅 April 3, 2025
Over the years, I’ve learned that discipline in trading isn’t just about having a system — it’s about being in the right state of mind to follow that system. 🧘♂️📈
You can have the cleanest rules, the best strategy, and solid backtests … but if your mindset is off, none of it matters. That’s when hesitation creeps in. Or worse — revenge trades, FOMO, or doubt.
So I started focusing on one thing: my internal state before and during a trade. 🧭
🔄 How I Manage My Mindset
✅ 1. Pre-Trade Check-In
Before I trade, I ask:
How do I feel right now?
If I’m not grounded, I don’t trade. Simple. I’ve learned the hard way that it’s not worth it.
🔥 2. Anchoring a Disciplined State
I recall moments where I executed perfectly — calm, focused, in control. I mentally step into that version of myself before every session.
🧩 3. Staying Congruent
During a trade, I pay attention to my behavior. If I notice myself drifting from my plan — I pause, breathe, and realign.
🎯 Why This Works
A trading system gives structure.
But structure means nothing without mental discipline.
By mastering my emotional state, I stopped sabotaging my own edge.
No more reacting from fear. No more chasing. Just clean, committed execution. 🧘♂️✅
💬 Final Thought
Consistency doesn’t come from the market — it comes from me.
So now, before I look at the chart, I check in with myself first.
Because when my state is right, my trading flows. ⚖️✨
If this resonates, drop your thoughts below — let’s grow together.

ENA About to Collapse or One Last Rally Before the Fall?Yello, Paradisers! Is ENA about to crash hard, or is a sneaky rally waiting to trap late bulls? Read this before making your next move!
💎#ENAUSDT has recently formed a Change of Character (CHOCH) while leaving behind a supply zone and an imbalance. Currently, we expect an upside correction toward $0.4333 and $0.4507, but this move is likely to be short lived. If the price taps these levels and faces strong resistance expect a sharp rejection, especially with the descending trendline and EMA 50 acting as barriers to bullish momentum. This setup suggests ENA is in a prime position for further downside unless it breaks above the supply zone.
💎If #ENAUSD fails to break the supply zone, a rapid sell-off toward the $0.34 support zone is highly likely. A visible gap imbalance further increases the probability of the price filling the gap before any potential reversal. Volume analysis also shows a clear surge in bearish activity, confirming strong selling pressure in the market.
💎The $0.34 level remains the most crucial support where buyers may attempt to step in. However, if this fails to hold, the next major demand zone sits around $0.30, where a deeper correction could unfold. Until a significant bullish breakout occurs, the risk of further downside remains high.
💎If the price manages to break above the supply zone, it would invalidate the bearish setup and could fuel a stronger rally. However, as long as the descending trendline and EMA 50 continue to hold back bullish momentum, the bearish outlook remains intact.
💎Will ENA hold support or break down further? Drop your thoughts in the comments! Are you positioning yourself for a move, or are you waiting for confirmation? Let’s discuss!
Stay sharp, Paradisers! The market rewards patience, discipline, and strategic thinking. Trade smart.
MyCryptoParadise
iFeel the success🌴

CTK/USDT in Danger? Key Levels That Will Decide the Next MoveYello, Paradisers! Is CTK/USDT on the verge of a major breakdown, or will bulls make a comeback? Let’s dive in!
💎#CTKUSDT has broken below its ascending channel, signaling a potential trend shift. Right now, the $0.41 - $0.42 level, which previously acted as strong support, has turned into resistance. This is a critical area if buyers fail to reclaim it, the selling pressure will likely continue. Adding to the bearish outlook, price is trading below both the EMA 50 and EMA 200, further confirming that sellers remain in control.
💎A fair value gap (FVG) near $0.41 could act as a magnet for a short-term bounce, but unless price reclaims this level with strength, the downtrend remains intact. If the rejection plays out, the next target to the downside is $0.3484, with a deeper drop potentially reaching the major support zone at $0.3091.
💎On the flip side, a break above the major supply zone at $0.4631 would completely invalidate the bearish setup and open the door for another strong rally. However, as it stands, the market structure favors further downside, and a rejection at resistance could accelerate the decline.
MyCryptoParadise
iFeel the success🌴

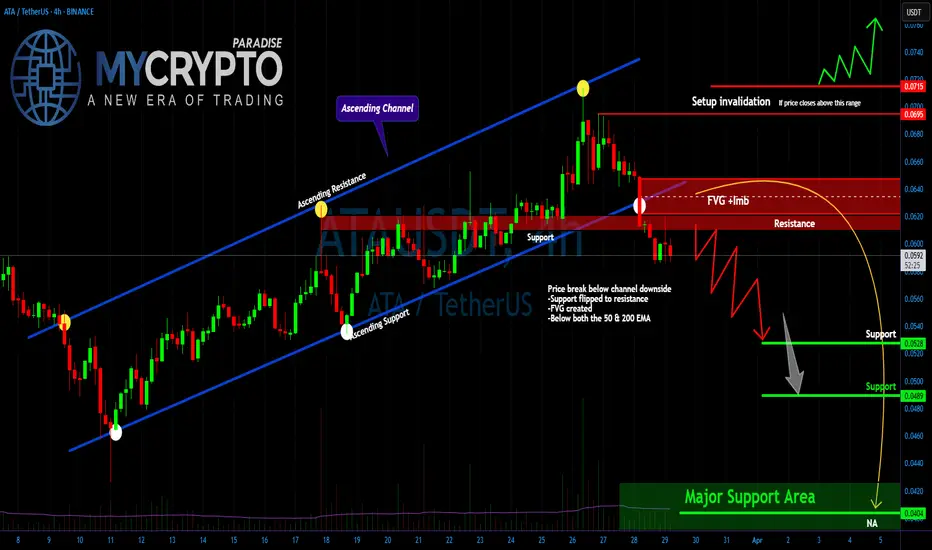
Major Breakdown Confirmed! Is a Bigger Dump Incoming? Yello, Paradisers! Did you catch this critical shift in price action? A major breakdown has occurred, flipping previous support into resistance and confirming a trend reversal from bullish to bearish. This shift has reinforced selling pressure, with price now trading below both the 50 & 200 EMA, signaling a strong bearish trend.
💎The market is currently testing resistance at $0.619. If this level holds, the probability of a significant drop increases. A Fair Value Gap (FVG) has also formed, indicating price inefficiency that may get filled before the next leg downward. If selling pressure remains dominant, a zig-zag decline toward lower support levels is likely. The key downside targets to watch are $0.0528, followed by $0.0489, with a major support zone resting at $0.0402.
💎Recent price action further supports the bearish bias. The last five candles have upper wicks, indicating strong rejection at higher levels. Volume is gradually declining, suggesting short-term consolidation before the next significant move. A bearish engulfing pattern has also emerged, reinforcing the likelihood of further downside.
💎To invalidate the bearish setup, price must close above the $0.0695 - $0.0715 range. A decisive breakout above this level would signal a possible trend reversal. Until that happens, the bias remains bearish, with expectations of continued downward momentum unless resistance is broken convincingly.
Stay patient, stay disciplined, and always wait for the highest probability setups. Those who follow the plan and avoid emotional decisions will be the ones who come out on top. Be a PRO!
MyCryptoParadise
iFeel the success🌴
BTC/USD – Long SetupPrice is testing a key structure level. If we get the right reaction, this could be the next move.
📍 Entry: 83085.00
🎯 Target: 88765.00
🛑 Stop-Loss: 81585.00
Risk-to-reward looks solid. Let’s see how this plays out! 🔥

DOTUSD: There is no better buy entry than this.Polkadot has been inside a huge Rectangle pattern since the October 19th 2023 Low that created the S1 Zone, a wide consolidation pattern whose top is the R1 Zone. The 1D RSI is already on a HL bullish divergence, identical to both prior bottom formations on the S1 Zone. Since the 1D MA50 has already been breached, we estimate that the price will start the new bullish wave soon. There is no better buy entry than the current level. Aim for the bottom of the R1 Zone (TP = 11.500).
## If you like our free content follow our profile to get more daily ideas. ##
## Comments and likes are greatly appreciated. ##

BTCUSD: We are nowhere near the top.Bitcoin has turned neutral again on its 1D technical outlook (RSI = 52.405, MACD = -937.300, ADX = 31.574) and should turn bullish once it crosses above its 1D MA50, which is now a 2 month Resistance. This simple illustration of cyclical tops and bottoms shows that the market is nowhere near a top and we will not consider selling until we enter October (2025).
## If you like our free content follow our profile to get more daily ideas. ##
## Comments and likes are greatly appreciated. ##

(ETH/USD) Breakout from Falling Wedge – Bullish Momentum Ahead?Ethereum (ETH/USD) Breakout from Falling Wedge – Bullish Momentum Ahead?
This 4-hour Ethereum chart shows a breakout from a falling wedge pattern, a bullish reversal formation. The price has started forming higher lows, signaling potential upside movement. The projected target is around $2,411, indicating a significant recovery.
A successful retest of the breakout level could confirm further upward momentum. Traders may consider long positions while monitoring resistance levels.
📌 Key Levels:
Support: ~$1,879
Target: ~$2,411
Resistance Zones: $2,100 - $2,200
Would you like me to refine this further? 🚀

Bitcoin (BTC/USD) Reversal? Rising Wedge Breakdown Signals Sell! The chart suggests a potential bearish move after a rising wedge pattern breakdown.
Key Observations:
Rising Wedge Breakdown:
BTC formed a rising wedge, which is a bearish reversal pattern.
The price has broken down from this wedge, indicating a potential downtrend.
Support and Resistance Levels:
Resistance Zone: Around $88,188 – $88,792, marked as a key level where selling pressure may increase.
Support Zone: Around $85,368 – $84,226, where buyers may step in.
Target: $81,429 – $81,258, a strong support level where price could drop.
Bearish Setup:
The chart suggests a sell opportunity near resistance, expecting a downward move toward the target zone.
Trading Idea:
Entry: Sell near $88,000 after confirmation.
Target: $81,429 – $81,258 (support zone).
Stop-Loss: Above $89,991 (resistance zone).
This setup suggests Bitcoin could decline further, making it a potential short trade opportunity. However, traders should watch for confirmation and overall market sentiment before executing trades.
