Ethereum Eyes $8K After Bullish BreakoutEthereum (ETH) is setting up for a powerful move. After hitting a multi-month high last week, ETH pulled back into a higher-low formation—strengthening the newly established bullish trend.
Money flow is shifting: with recent crypto legislation, Ethereum is now benefiting even more than Bitcoin, marking a notable change in market dynamics.
📈 Technical Highlights:
✅ Short-term target: $4,800–$5,000 (new all-time highs)
✅ Long-term potential: $7,000–$8,000
🛡️ Key support: $2,800–$3,000 (bullish as long as this holds)
📣 Takeaway:
Ethereum’s trend is firmly bullish. As long as support holds, pullbacks could offer strong entry opportunities for both swing traders and long-term investors.
#Ethereum #ETHUSD #Crypto #Trading #TechnicalAnalysis #CryptoTrading #EthereumPrice #Altcoins #Bullish #Breakout
Cryptotrading

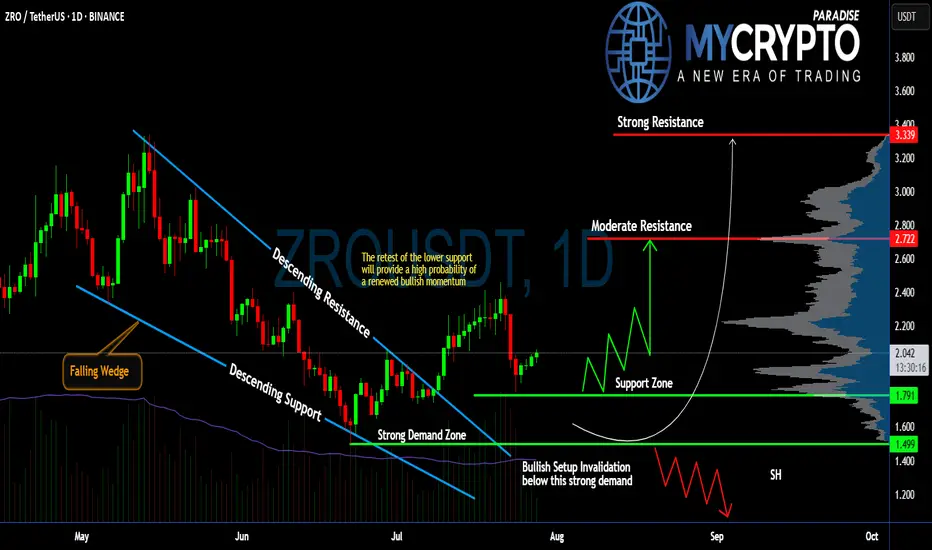
Will #ZRO Continue to Climb or Not? Must Watch For BullsYello, Paradisers! Are we witnessing the beginning of a powerful bullish reversal on #ZROUSDT, or is this just a fakeout setup? Let’s dissect this setup of #LayerZero:
💎After weeks of consistent bleeding, #ZRO has printed a classic falling wedge pattern, often a precursor to bullish reversals. This wedge has now been broken to the upside, with price currently trading around $2.037, suggesting renewed buyer interest following the breakout from descending resistance.
💎What’s crucial here is the retest of the wedge’s descending support, which aligns perfectly with a strong demand zone between $1.499 and $1.791. As long as #ZROUSD respects this zone, the probability of a bullish continuation remains high. This zone also serves as a clear invalidator for the setup—if price closes below $1.499, the bullish thesis will be off the table.
💎From here, if bulls can maintain control, we’re eyeing a potential move toward the moderate resistance at $2.722. That’s the first real hurdle where profit-taking or short interest could spike. A clean break above that level would open the path to the strong resistance around $3.339, where a heavy supply zone is likely to cap further upside.
💎Until then, we expect a series of zigzag corrections above the support zone before any sustained push higher. However, be cautious, losing the $1.499 support turns the structure bearish and could drag the price toward the $1.20 region, or lower.
Stay patient, Paradisers. Let the breakout confirm, and only then do we strike with conviction.
MyCryptoParadise
iFeel the success🌴
CARDANO (ADAUSD): Bullish Move Ahead!
ADA is testing a key daily support cluster.
I think the market is going to bounce from that
and continue growing.
Next resistance - 0.97
❤️Please, support my work with like, thank you!❤️

ETH Versus BTC - Daily Update - Bitcoin still winning
As mentioned yesterday, ETH has hit long term resistance and got rejected....and it is happening again
ETH seems unable to find the moemntum just yet.
The MACD Daily is still turning Bearish
The Daily RSI is also up high and likely to fall
The weekly RSI is also high though the Weekly MACD has still yet to rise above Neutral
All in All, for me, it is NOT the time....Though we can see that ALTS are running Hot though not a full ALT season as we have seen in the past.
It is fragile...please remain CAUTIOUS
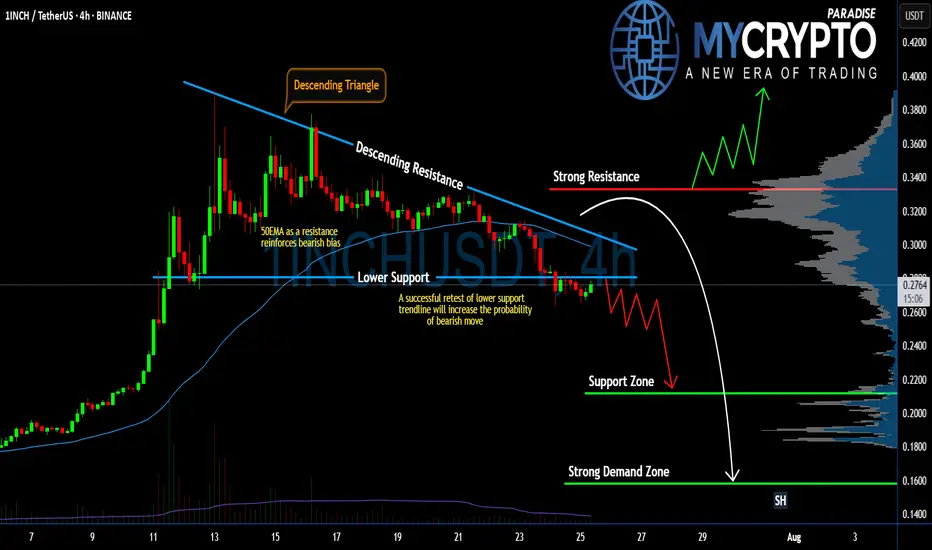
#1INCH Setup Favors Bears | Can Bears Pull it Down Further? Yello Paradisers! Are you prepared for what might be the next big move on #1INCHUSDT? The #1INCHNetwork is flashing clear warning signs:
💎#1INCH is currently trading inside a Descending Triangle, a pattern that historically favors bears. The price has broken down the lower support and is coming to retest it. If #INCHUSD retests the lower support and doesn't enter the descending triangle, the probability of the bearish pressure will increase.
💎The 50 EMA is acting as a strong dynamic resistance, reinforcing the bearish bias. Every attempt to reclaim higher levels has been rejected, and as long as we remain capped below the descending resistance, bulls are at a clear disadvantage.
💎A successful retest of the lower support trendline will significantly increase the probability of a breakdown. If this triangle finally breaks to the downside, we should be watching the $0.2116 support zone as the first key level to catch any temporary reaction.
💎But the real danger — and opportunity for patient traders — lies lower. If $0.2116 fails, the next strong demand zone sits at $0.1582, which could be the level where real buyers finally step back in. Until then, any bullish scenario remains invalid unless the price breaks and closes above the strong resistance at $0.3332.
Trade smart, Paradisers. This setup will reward only the disciplined.
MyCryptoParadise
iFeel the success🌴
BITCOIN (BTCUSD): Recovery Starts
Bitcoin is going to rise from a key daily support.
After a liquidity grab, the market shows a clear strength,
forming a double bottom on an hourly time frame.
I expect a bullish movement at least to 117100
❤️Please, support my work with like, thank you!❤️
I am part of Trade Nation's Influencer program and receive a monthly fee for using their TradingView charts in my analysis.

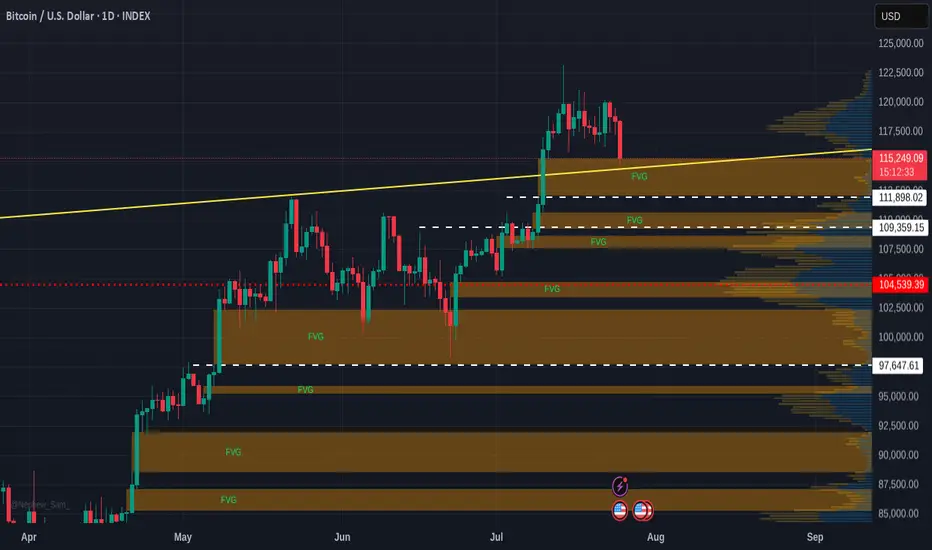
Quick BITCOIN Fair Value Gap Update -Where will dip stop
The sharp drop caused by Galaxy Digital seel off has brought PA to a line of support but also to the top of a Fair Value Gap ( FVG)
This could cause a further slide as traders decide to try and pick up some BTC from this gap.
FVG have a tendancy to be used as Good trading spots due to the lack of previous trading in that range
So, if support breaks, we could see a return to 111K as the fist gap gets filled.
We could alsp return to 109K - 107Kshuold momentum continue.
And finaly, should the move seem to attractive to some, a final Wick down to 97K is possible. This would Terrify many and would also be such a Good opportunity to buy.
I think it is unlikely though
Just my opinion but I am looking to place Buy orders between 109 - 107......just incase
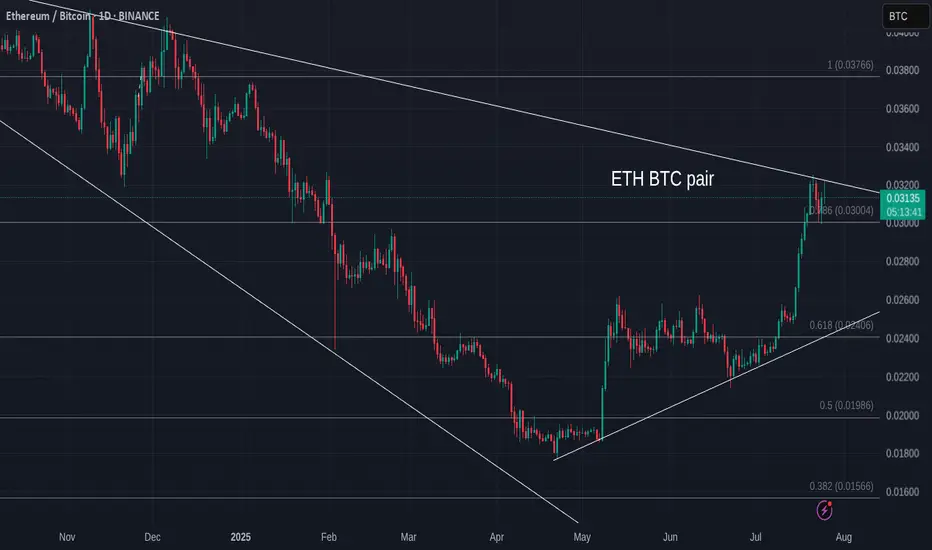
Lets look at ETH V Bitcoin for a moment, before you jump in
Ever since Nov 2021, ETH has Lost Value compared to Bitcoin, as we can see on this ETH BTC chart.
Even while Bitcoin entered a Deep Bear market, ETH lost More....
And now, as we see ETH make a strong move, we have people screaming, "ETH to 10K"
And given how ETH is backed by almost everything American, as America wants ETH as its own Crypto.
Nut lets look here at simple idea.
ETH is up agains Stiff long Term resistance right now.
If we look at the daily chart.
We can already see how PA has been bumped down...an is trying again, even with a daily MACD turning Bearish
The weekly MACD has room to go higher and so I do expect PA to break over resistance and to nreak higher should sentiment remain strong.
As ever, this relies HEAVILY on BTC Dominance and Bitcoin PA to play along.
For me, I am not touching it, even if I can make money on it..
Principles

XRP/USD – Bearish Shift After Momentum Exhaustion🧠 Summary:
XRP/USD has shown clear signs of exhaustion after sweeping the previous high. Following a breakout from a daily bull flag, price struggled to hold momentum near the key level of 3.4194, forming an ascending channel that eventually broke down. Liquidity zones below current price are now in focus.
🔍 Technical Breakdown:
✅ Daily Bull Flag → Broke out with strength
⚠️ Rejection near Previous High (3.4194) → No follow-through
🔼 Ascending Channel → Formed post-impulse, now broken
📉 Momentum Shift → Structure flipped bearish
💧 Liquidity Zones (LQZ) below price acting as magnets
📌 Key Levels:
🔹 Last High: 3.4194 (Rejection Point)
🔹 Broken LQZ: 3.2868
🔹 Current Support: 3.1689 (LQZ - being tested)
🔹 Target 1: 2.9849 (4HR Liquidity Zone)
🔹 Target 2: 2.7667 (Daily Liquidity Zone)
🧩 Confluences:
Liquidity sweep of prior high
Momentum loss near key resistance
Break of ascending structure
Retesting broken zones with room below
⚠️ Final Thoughts:
This trade is playing out just as we described in the post before this on XRP. We discussed watching how price would react to this area before making any type of "Late Entries". XRP is still a huge and vital part of the Crypto Eco System so long term i am holding my Long position. The areas on the chart are still great areas to buy in at "Dollar Cost Average". This will be one of those positions that though it may be bearish on the lower time frame you need to zoom out and always keep an eye on the weekly and daily chart before making any drastic moves.

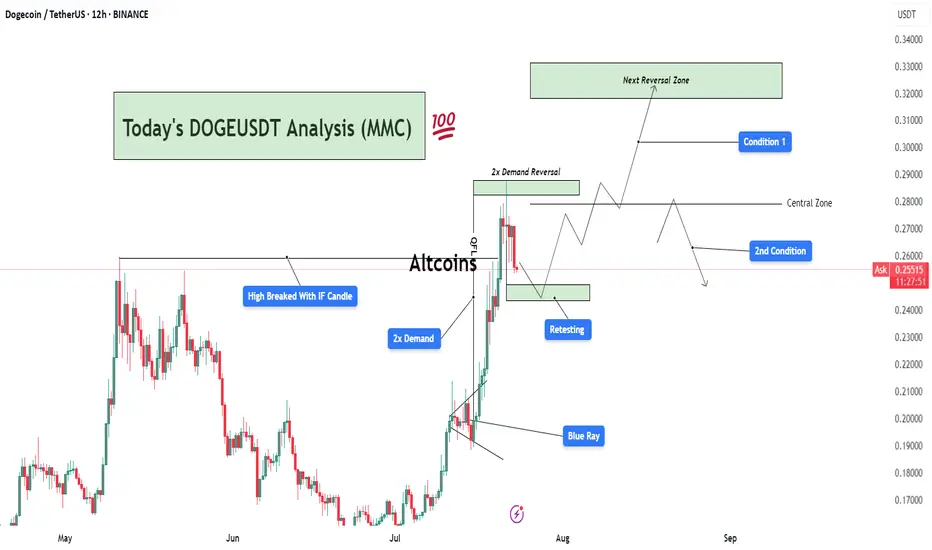
DOGEUSDT Analysis : Demand Zone Retest Before New Highs Target📊 Overview:
Today's DOGEUSDT analysis (12H chart) under the Mirror Market Concept (MMC) framework reveals a potential bullish continuation or corrective phase based on two major conditions. The market structure is transitioning after a strong impulsive move, triggered by a 2x Demand Zone breakout, and is now in the retesting phase.
🔍 Key Technical Breakdown:
High Broken with IF Candle:
A significant previous swing high was broken decisively by an Initiation Flow (IF) candle, indicating institutional activity or aggressive buying pressure.
This confirms a shift in market structure toward a bullish trend.
2x Demand Zone:
This zone has served as a strong base for price accumulation and an impulsive breakout.
The market responded well with a sharp rally post this demand, validating it as a critical support.
Blue Ray Zone (Support Zone):
The bullish breakout was partially driven by this inner trendline zone (referred to as Blue Ray), where price respected the rising support channel before breakout.
This shows smart money liquidity engineering prior to the breakout.
Retesting Zone:
Currently, the price is retracing toward a previously broken demand zone.
If this zone holds, it could provide an optimal entry for continuation.
📈 Two Scenarios (Conditions):
✅ Condition 1: Bullish Breakout to Next Reversal Zone
If the retest holds and price prints bullish confirmation (e.g., engulfing or pin bar), we can expect price to move up toward the next key reversal zone between $0.3100–$0.3300.
This zone is marked as a potential supply/reversal zone, where large sell-offs may occur.
This path follows the continuation structure under MMC, aligning with trend-following buyers.
⚠️ Condition 2: Failure to Hold Demand → Deeper Pullback
If the current demand zone fails to hold and price re-enters below the central zone (~$0.2700), we could expect a deeper correction.
Price may then revisit lower demand regions, potentially toward $0.2200 or lower, depending on rejection strength.
📌 Important Notes:
The central zone acts as a pivot level, defining whether bulls or bears gain short-term control.
Monitor the reaction from retesting area closely — candle confirmation is key before any trade execution.
This chart follows Mirror Market Concepts (MMC), combining smart money behavior, demand/supply reversal logic, and psychological market zones.
💬 Final Thoughts:
DOGEUSDT is currently in a critical phase. The market has shown strength, but now it's about confirmation. Patience is key — wait for a clean break or rejection around the retesting zone to determine the next direction. The analysis favors bullish continuation, but being flexible with both scenarios gives traders an edge.
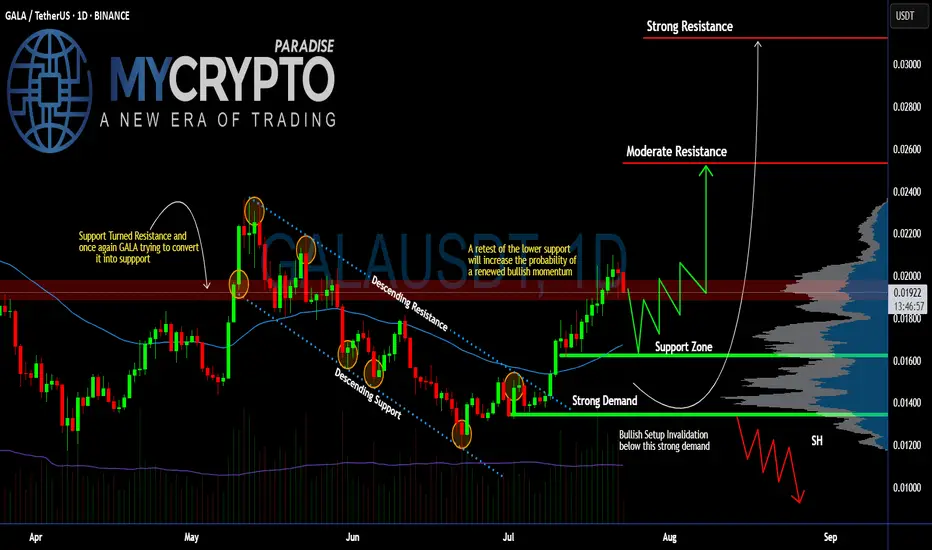
Can #GALA Sustain the Current Bullish Momentum or Will it Fall?Yello, Paradisers! Is this #GALA pullback just a healthy retest before another explosive rally, or are we about to see a deeper drop that will wipe out impatient bulls? Let’s break it down:
💎After weeks of trading inside a descending channel, #GALAUSDT finally broke above the descending resistance, sparking renewed bullish momentum. The breakout has pushed the price toward the $0.020 zone, but now #GALA has encountered a resistance zone (previously support). The question remains: will GALA maintain this level or revisit lower supports before proceeding higher?
💎The current structure shows #GALAUSD attempting to convert its previous resistance into new support around $0.018–$0.020. A clean retest of this support zone would significantly increase the probability of a sustained bullish continuation. The 50EMA acting as support and positive macro trend in crypto market reinforces our bullish bias.
💎If buyers remain in control, the first upside target is the moderate resistance at $0.0253. However, the major profit-taking and strong selling pressure are expected near the $0.0312 zone, where the strongest resistance lies. A successful break and hold above this level would confirm a more aggressive bullish trend.
💎On the flip side, the bullish setup becomes invalid if #GALA loses the strong demand zone at $0.0162–$0.0134. A confirmed close below $0.0134 would flip the structure bearish and open the door for another leg down.
Stay patient, Paradisers. Let the breakout confirm, and only then do we strike with conviction.
MyCryptoParadise
iFeel the success🌴
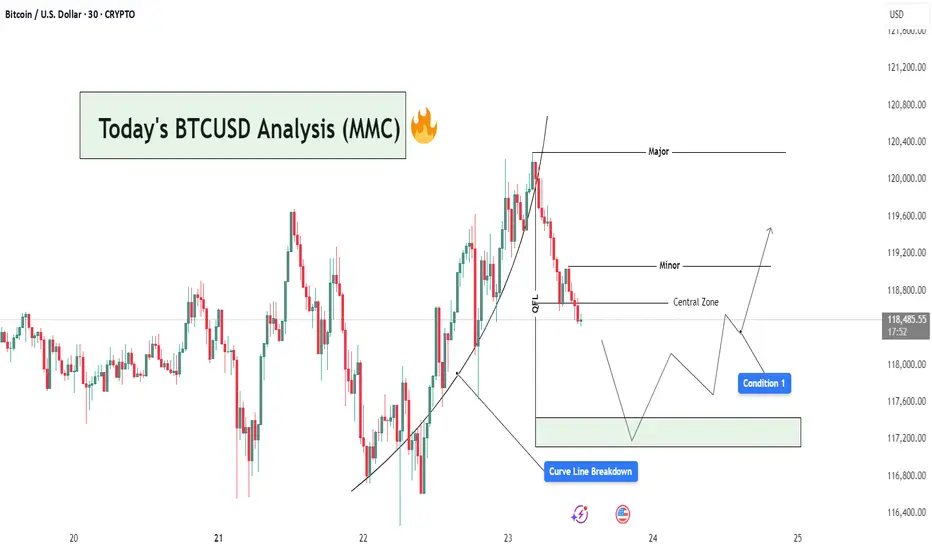
BTCUSD Analysis : Curve Line Breaked and Move Towards Target📊 Market Overview:
BTCUSD has recently completed a strong bullish leg, following a parabolic curve formation that led price into a Major Resistance Zone near the $120,400 level. This rally aligns with MMC principles where price forms momentum-driven structures before reaching high-liquidity zones (often ending in exhaustion).
📍 1. Curve Line Support & Breakdown – A Shift in Sentiment
Your chart shows a clear Curve Line that supported the bullish impulse. Price respected this dynamic support throughout the uptrend until a Curve Line Breakdown occurred—marking the first sign of bullish weakness.
In MMC strategy, this curve structure breakdown is critical:
It tells us the accumulation → expansion → exhaustion cycle is ending.
The market is likely entering retracement or distribution phase.
Price often seeks lower equilibrium, typically around the Central Zone.
🧠 2. QFL Zone (Quick Flip Level) – The Hidden Base
Immediately after the curve broke, price moved toward the QFL level, which represents a demand base from earlier structure. This zone acts as a short-term support and often produces a reactive bounce (but not always a reversal).
Watch closely:
If price respects this zone → temporary relief bounce
If it fails → we’ll likely see full test of Central Zone or lower demand levels
🟩 3. Central Zone – The MMC Decision Area
The Central Zone is a key horizontal level on your chart, defined between ~$117,300 and ~$118,200. This zone is marked based on:
Previous structure
Volume clusters
Demand imbalance
Why is this zone important?
It serves as the balance point between buyers and sellers.
A bullish reaction here could re-initiate a move toward Minor Resistance (~$119,200).
A failure to hold could open the door for deeper retracement toward the green demand box (~$117,200 or below).
🔄 4. Two Primary MMC-Based Conditions to Watch:
✅ Condition 1: Bounce from Central Zone
Price reacts from within the Central Zone
Forms bullish structure (double bottom, bullish engulfing, or reversal wick)
Short-term target becomes Minor Resistance (~$119,200)
If volume increases and price breaks above Minor, continuation toward Major is possible
❌ Condition 2: Breakdown & Bearish Continuation
Price fails to hold within Central Zone
Bearish structure forms (e.g. lower highs, breakdown candles)
Clean move expected toward next liquidity pocket at $117,200–$116,800
This would confirm market shifting into bearish control
📌 5. Minor vs Major Levels – Key Zones
Minor Resistance (~$119,200): Short-term target if bounce occurs
Major Resistance (~$120,400): Liquidity sweep zone, strong supply
Green Demand Box (~$117,200): If Central Zone fails, this becomes next bounce zone
📘 Final Thoughts:
This is a classic MMC setup in real-time:
Curve Formed → Broke
OFL + Central Zone → Now being tested
Next move depends on confirmation from buyers or sellers at Central Zone
Don’t trade emotionally — let price action give you confirmation before taking any positions. Watch the Central Zone behavior closely and manage risk based on scenario outcomes.
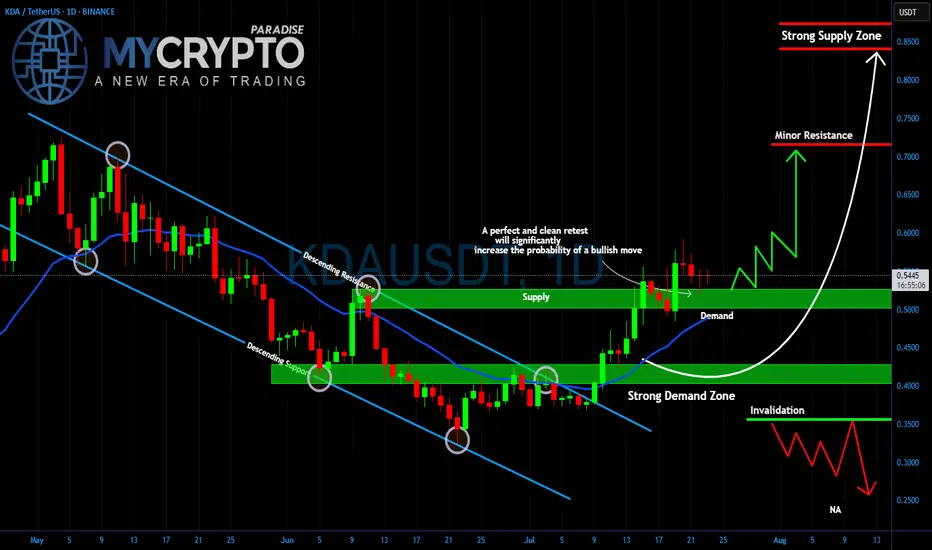
KDA Breakout or Fakeout? Critical Retest AheadYello Paradisers, is #KDA setting up for a major bullish move, or are we looking at another trap designed to wipe out impatient traders? The price has broken out of the descending channel that has been controlling the market for weeks, and now all eyes are on the retest.
💎The strong demand zone around $0.40–0.45 has been the key accumulation area for weeks, holding firmly every time the price dipped. Right now, #KDAUSDT is trading above the $0.50–0.55 demand level, which is acting as a critical support. A clean and confirmed retest of this zone would dramatically increase the probability of a bullish continuation.
💎If buyers step in aggressively, the first target will be the minor resistance at $0.70. Breaking above that could open the way for a push toward the strong supply zone at $0.85, where heavy selling pressure is expected. But if the demand fails and price drops below $0.35, this bullish scenario is invalidated, and a deeper move towards $0.25 becomes likely.
Trade smart, Paradisers. This game rewards patience and discipline, not reckless entries. Stick to your strategy, and you will stay ahead of the herd.
MyCryptoParadise
iFeel the success🌴
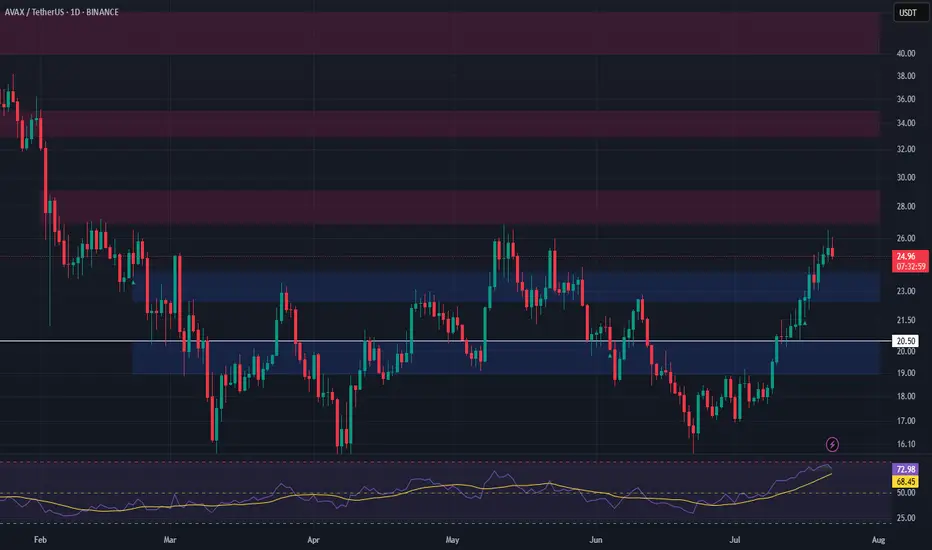
AVAX Long Swing Setup – Waiting for Support RetestAVAX has been rallying for two straight weeks, showing strong momentum. We’re watching for a healthy pullback into the $22.50–$24.00 support zone to position for continuation. If this zone holds, the risk/reward setup favors bulls with clear upside targets.
📌 Trade Setup:
• Entry Zone: $22.50 – $24.00
• Take Profit Targets:
o 🥇 $27 – $29
o 🥈 $33 – $35
o 🥉 $40 – $44
• Stop Loss: Daily close below $20.50
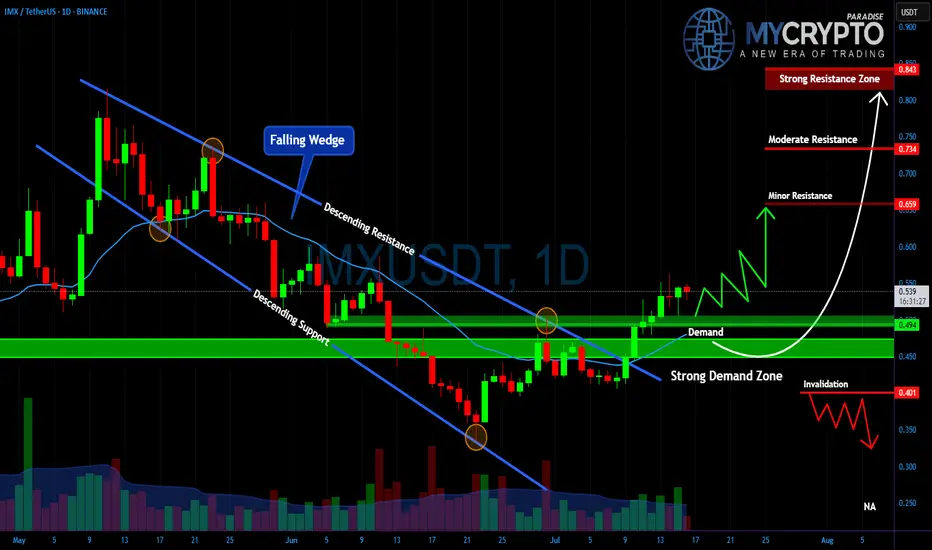
IMXUSDT – Major Breakout or Another Painful Trap Ahead?Yello Paradisers, is this the real start of a powerful bullish reversal on #IMX, or just another classic setup to liquidate impatient traders before the true move begins? The next few days will decide everything.
💎#IMXUSDT has broken out of a falling wedge, which is a typical bullish reversal structure, and is now retesting the strong demand zone between $0.45 and $0.49. As long as the price holds above this level, the bullish scenario remains intact, with $0.659 as the first key resistance to watch.
💎A clean break above $0.659 could open the way toward $0.734, while the critical resistance zone at $0.843 will be the ultimate test of whether IMX can shift into a sustained uptrend.
💎However, the invalidation level sits at $0.401. If this level fails, expect a fast move back toward $0.30, which will likely wipe out many traders who jumped in too early.
This is exactly where most retail traders get trapped. They either chase the move too late or panic-sell too early.
MyCryptoParadise
iFeel the success🌴
Ethereum: Breakout Holds Strong | Next Targets $4K, $7K+Last week, three major crypto bills cleared the U.S. House of Representatives—and Ethereum (ETH) is emerging as the biggest winner from this legislative momentum.
ETH recently broke out of a rounding bottom pattern and hasn’t looked back. Momentum continues to build, and it’s now outperforming most other major assets.
📈 Technical Highlights:
✅ Short-term target: $4,000
✅ Long-term potential: $7,000–$8,000
🛡️ Key support: $2,700–$2,800 (bullish as long as this holds)
📣 Takeaway:
Ethereum’s breakout remains intact. Pullbacks into support could offer high-probability setups for swing traders and long-term investors.
#Ethereum #ETHUSD #Crypto #Trading #TechnicalAnalysis #CryptoTrading #EthereumPrice #Altcoins #Bullish #Breakout

$PENGU: Taking Profit and Watching for a TurnIf you find this information inspiring/helpful, please consider a boost and follow! Any questions or comments, please leave a comment!
PENGU has made a strong move off the 0.007 level, now it just popped cleanly out of consolidation beneath the key LOI at 0.032. That break gave us the signal we needed for continuation, and so far, the price has followed through nicely.
But now, we’re approaching a zone where things could get a bit trickier.
This advance is starting to look like a classic wave 3 impulse, and while there’s no clear confirmation of a top yet, signs are beginning to flash caution. That means it’s time to start watching for potential topping behavior—especially if we move into a broader consolidation phase.
Here’s what’s on my radar:
• Wave 3 Exhaustion?
Still unconfirmed, but this could be the final leg of the wave 3 structure.
• AOI or Key Level Rejection
A stall or strong reaction near resistance could be a red flag. Channel parallel being reached.
• Bearish Divergence on the EWO
Momentum isn’t keeping pace with price. That’s often a precursor to a deeper pullback.
No need to force the next move here. This thing could just keep ripping up, but I am being extra cautious here. Not only to look for a potential top, but if a retrace is given, a potential long add to my current trade. Taking profit at these levels makes sense, especially given the early entry from 0.012 and my trade plan.
As always, trade what’s printed, not what’s hoped for. Stay nimble.
Trade Safe!
Trade Clarity!

Ethereum at Crucial Resistance – Will the Bulls Hold or Fade?Ethereum at Crucial Resistance – Will the Bulls Hold or Fade?”
Ethereum is currently trading near a key resistance zone around $3,800, as marked on the chart. After a strong bullish rally with clear Break of Structures (BOS) along the way, ETH has now reached an extended point where price may face selling pressure.
The Bollinger Bands are stretched, showing overextension, and the marked arrow suggests a possible correction or pullback from this level. A retest of previous support zones (~$3,400–$3,200) could be expected if the resistance holds.
⸻
Key Levels:
• 🔼 Resistance: ~$3,800
• 🔽 Support: ~$3,400 / ~$3,000
• 🔄 Price Action: Watching for rejection or breakout confirmation
This is a textbook case of price approaching a strong resistance level after a bullish wave, where caution and confirmation are key for the next move.

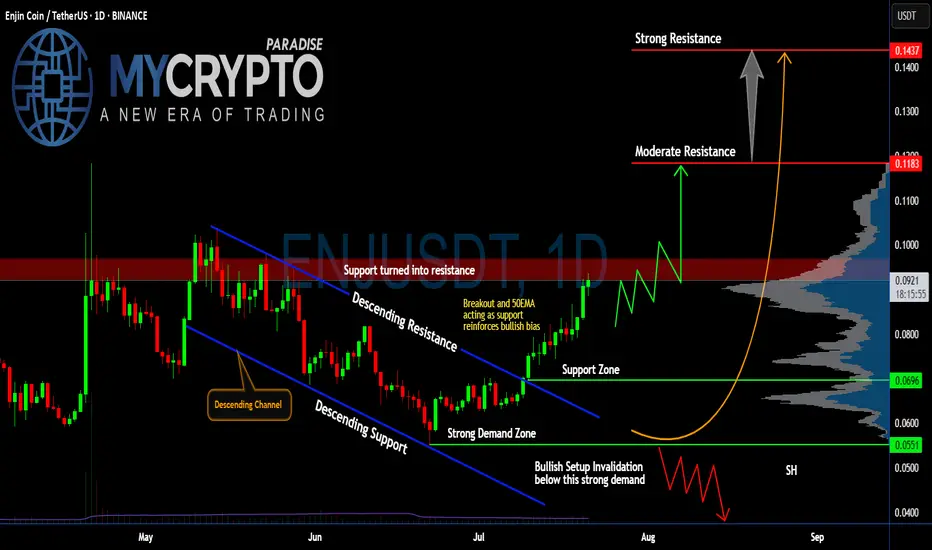
Will #ENJ Soar Further or a Trap is Set Ahead? Watch Closely Yello, Paradisers! Is this breakout on #ENJUSDT the start of a strong bullish reversal, or just another trap before a brutal flush to shake out late buyers? Let’s break it down:
💎After weeks of bleeding inside a clear descending channel, #EnjinCoin has finally broken out of the descending resistance, showing the first real bullish momentum in a while. Price is currently trading around $0.0917, with the 50EMA now acting as fresh support—this adds weight to the bullish bias for #ENJ.
💎If bulls can break above the resistance zone (previously support) between $0.091 and $0.096, we could see a push toward the moderate resistance at $0.1183. That’s the first major hurdle where sellers are expected to step in. A clean breakout above this level would open the door for a larger move toward the strong resistance at $0.1437, where a heavy supply zone sits, and profit-taking will likely accelerate.
💎The strong demand zone between $0.0551 and $0.0696 has been respected multiple times in the past, with aggressive buying every time price dipped into it. This is classic accumulation behavior, which often precedes stronger impulsive legs up—if volume keeps supporting this move.
💎But don’t get trapped, Paradisers. If the price breaks back below $0.0696 and especially loses the strong demand at $0.0551, the bullish setup for #ENJUSD will be invalidated. That would likely trigger a deeper correction, pushing us back toward $0.04. We’ll wait patiently for the next high-probability setup before taking any new positions.
Stay patient, Paradisers. Let the breakout confirm, and only then do we strike with conviction.
MyCryptoParadise
iFeel the success🌴
SUPER Breakout Incoming or Just Another Trap Before the Flush?Yello, Paradisers is SUPER about to explode out of this structure, or are we being lured into a fakeout before the next rug pull? This setup is too clean to ignore, and the next few candles will tell us everything.
💎The daily chart on #SUPERUSDT reveals a well-respected descending channel that has dictated price action for over two months. After multiple rejections from the upper boundary and rebounds off the lower trendline, the price has now shown its first serious signs of momentum since bottoming in the strong demand zone around $0.45–$0.50. This zone has held firmly, marking the third time price has bounced from this key level a textbook area of interest where buyers consistently step in.
💎What's notable here is the confluence between the demand zone and the descending support line. The most recent bounce was not only from this dual-support area, but also accompanied by a shift in momentum that has pushed the price back toward a critical inflection point the resistance-turned-support zone at $0.58–$0.62. This level has acted as resistance before and now becomes the level to reclaim for the bullish scenario to stay valid.
💎If the price breaks and closes above the upper boundary of the descending channel and holds above the $0.60–$0.62 region, the path opens toward the moderate resistance at $0.75. Should bullish momentum continue, we could be looking at a retest of the psychological and historical strong resistance zone near the $1.00 mark where we’d expect both aggressive profit-taking and liquidity to build up.
💎On the flip side, any failure to break out and sustain above the current resistance would likely send price back down to retest the demand zone. If the structure gives in and closes below $0.45 on the daily timeframe, this would invalidate the bullish thesis completely and could trigger a sharper drop toward $0.35 or even lower as the broader market liquidates over-leveraged longs.
MyCryptoParadise
iFeel the success🌴

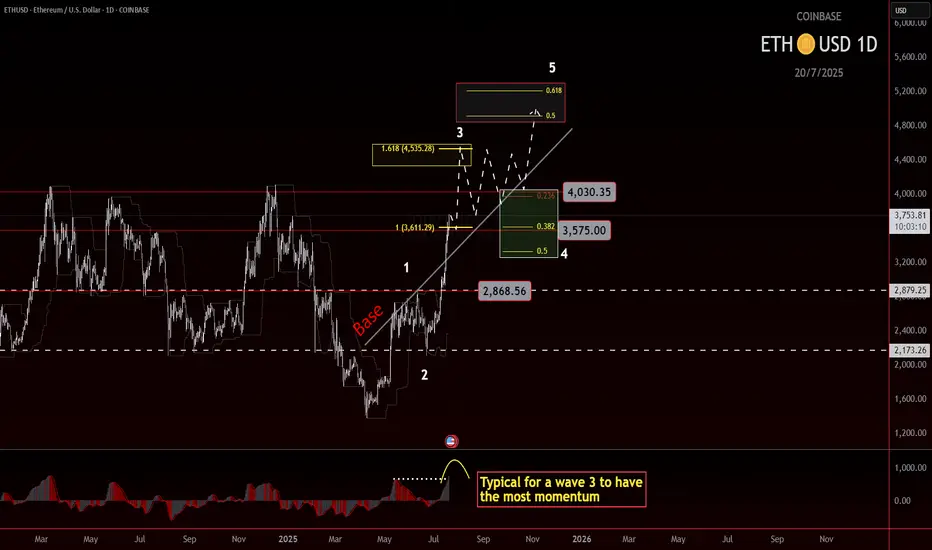
ETH roadmap to 5000!Ethereum Wave 3 in Play? Eyes on the $4500 Target
Ethereum may currently be progressing through a wave 3, which is often the strongest leg of an impulse. The structure so far supports that idea, and based on standard projections, the most likely target sits near $4500.
If price can break and hold above the 4k level, we could see a consolidation forming above the previous high. That would be a constructive sign and might set up the next leg higher.
But there’s still a chance ETH struggles to clear that level. If that happens, consolidation could form just underneath, which would still be acceptable within a wave 3 framework. What matters next is the shape and depth of the pullback.
Wave 4 will be the key. A shallow or sideways correction would keep bullish momentum intact. A deeper pullback doesn't ruin the structure, but it does mean we’ll need to watch support zones more closely.
If wave 4 behaves well and broader market conditions stay supportive, then a final wave 5 could bring ETH into the $5000 region. That’s the upper edge of this current roadmap, based on conservative assumptions.
Stay flexible. Let the structure guide the bias.
Bitcoin 2013 Fractal chart UPDATE = Nailed the PA target
Been posting this chart for the last few years and drew that Circle that PA hit, back in Feb..Way befppre PA arrived there.
I also drew that dashed Arrow line at the same time ad, as we can see frm the Daily chart beow, PA is bang on that line.
Why is it importnat that you know this ?
Because those Circles and Dashed lines are transposed from teh 2017 - 2021 fractal !
We do seem to have moved from one Fractal to another.
This has yet to be fully confirmed and the July Candle Close will certainly help identify this if we get a large green candle.
So, for now, we wait.
I will post more details about this later but fir now, if we follow this line, we can expect a cycle ATH of around 270K - 322K in Q4 2025
And then the BIG question is "What is next ?" because, as I have pointed out n another posts, we are also leaving a long term cycle (2009 - 2025 ) line of resistance....that we just broke free of...but need to remain above.
Judy is CRUCIAL

Most Will Get Trapped on EGLD’s Next Move Don’t Be One of ThemYello Paradisers, did you catch the EGLD breakout or are you still waiting for confirmation that’s already gone? While most traders are sleeping on this setup, it has just completed one of the cleanest breakout-and-retest patterns we’ve seen in weeks, and what comes next could leave many trapped on the wrong side.
💎#EGLDUSDT recently broke through its descending resistance with strength and has now retested that same level, which is acting as solid support in the $14.30–$15.00 range. This successful flip of resistance into support is a textbook bullish signal, and it’s holding beautifully indicating strong buyer presence and increasing the probability of continued upside.
💎If this support holds firm, #EGLD is eyeing a move toward the $18.00–$18.25 region, where moderate resistance is expected. A break above this could open the path toward the $19.90–$20.40 zone, a significant resistance level that may shape the next macro structure on this chart.
But it’s not all upside. If EGLD fails to hold the $13.00 level and especially the key invalidation point at $11.85 this entire bullish setup breaks down, and sellers will likely take control. The bullish momentum would collapse fast, and the door would open to much deeper downside levels.
MyCryptoParadise
iFeel the success🌴
