ETHBTC Daily Looks Constructive
ETHBTC on the daily is about to close above the previous top (pink line).
The next major resistance is the 200MA, which is not far above.
Both the SMA and MLR are above the BB center—a constructive sign.
Watching ETH/BTC closely can help shape expectations for ETH/USDT.
Always take profits and manage risk.
Interaction is welcome.
Cryptotrading

Is AAVE About to Explode Above or Collapse? Key Levels to WatchYello Paradisers! Is #AAVE quietly prepping for a major breakout… or is this just another setup to wipe out the impatient bulls before the real move begins?
💎#AAVEUSDT is moving in a textbook ascending channel, respecting both trendline resistance and support beautifully. The structure is clean, but deceptive. While many may assume this is an easy path higher, seasoned traders know better — especially with what’s happening near the critical resistance zone.
💎The red resistance zone ($270–$280) that was previously a major support during the last cycle is now acting as heavy resistance again. #AAVEUSD is currently battling this zone after several failed attempts to break through. But the structure still leans bullish as long as we stay within the ascending channel.
💎Both the 50 & 200 EMA are now acting as dynamic support. This is key — if the price remains above these EMAs and the lower channel boundary, momentum favors the bulls. A decisive breakout above $280 could trigger a parabolic rally toward the $375–$410 range, a level where serious resistance and profit-taking are expected.
💎However… if bulls get lazy and we see a strong breakdown below the ascending channel, especially below $237, the setup gets shaky fast. A complete invalidation of the bullish case occurs if AAVE loses $209 — from there, expect a breakdown structure to unfold with a likely test of much lower levels and a possible retest of the $150 zone.
Trade smart, Paradisers. This setup will reward only the disciplined.
MyCryptoParadise
iFeel the success🌴

ETH Daily Close Signals Entry
On the daily, ETH is closing above both the 200MA and the previous tops. PSAR on the original system has flipped, though the free-to-use version hasn’t yet.
This is a trading idea. If you choose to allocate real capital, be prepared for the possibility of loss. But if you trust the system enough to allocate capital, trust that the PSAR has flipped and today’s close marks the entry.
It’s exactly how the system defines a valid setup:
Daily close above the 200MA, with MLR > SMA > BB center.
The 12H timeframe acts as confirmation from the lower TF, and the 4H is already green and ripping.
So buckle up—this could be a ride worth taking.
Always take profits and manage risk.
Interaction is welcome.

ETH – System Trigger Hit
ETH on the 12H has just reclaimed the green line: resistance from the previous tops.
This level sits roughly midway between the 0.5 and 0.382 Fib levels, with \$3000 now looking closer than \$2500.
PSAR has just flipped above the last tops, and price is now above MLR > SMA > BB center > 200MA.
All system conditions are met for a long entry on this timeframe.
This also comes as confirmation of the daily signal entry at today closing
Always take profits and manage risk.
Interaction is welcome.

BTCUSD: Very aggressive rally to 130k has just started.Bitcoin turned bullish again on its 1D technical outlook (RSI = 61.233, MACD = 1503.700, ADX = 19.938) following yesterday's strong 1D candle, which is a result of the June 6th 1D MA50 rebound, and is even close to turning the day positive despite the correction early on. This rise is similar to the one that started after the April 7th rebound and eventually pearked just under the 2.382 Fibonacci extension. We remain bullish on Bitcoin, TP = 130,000.
## If you like our free content follow our profile to get more daily ideas. ##
## Comments and likes are greatly appreciated. ##

Bitcoin - Here we have the all time high!Bitcoin - CRYPTO:BTCUSD - is just getting started:
(click chart above to see the in depth analysis👆🏻)
It was really just a matter of time until we see a new all time high on Bitcoin. Consindering that over the past two months alone, Bitcoin rose another +50%, this was a clear indication that bulls are taking over. But this all time high is clearly not the end of the bullrun.
Levels to watch: $300.000
Keep your long term vision!
Philip (BasicTrading)

AAVE Breaks Major Resistance Is a Mega Rally Toward $460 on the Yello Paradisers, are you watching how #AAVEUSDT just exploded past its resistance zone? After weeks of slowly grinding upward inside a clean ascending channel, AAVEUSDT has just delivered a powerful breakout that could open the gates for a major continuation to the upside.
💎This breakout came with strength supported by strong green candles blasting through the previously established resistance zone near $280. The price decisively reclaimed this area, which has now flipped into a fresh support zone. As long as AAVE holds above this reclaimed region, the bullish momentum remains dominant and the probability of continuation grows significantly.
💎From a structural standpoint, #AAVE had been respecting a well defined ascending channel with rising support and resistance levels. Each pullback within the channel has been met with renewed demand, indicating strong market interest at every dip. The recent consolidation at resistance, followed by the aggressive breakout, confirms that the bulls are in control at least for now.
💎Looking ahead, the next visible target is the minor resistance at $357, followed by $380 and ultimately, the major supply zone between $460 and $470. These areas could act as points of reaction, but with momentum on AAVE’s side, the path upward remains technically cleanespecially if volume sustains.
💎On the downside, the invalidation of this bullish structure would come with a sharp drop below the key demand zone at $220. A breakdown below this level would shift the narrative and signal deeper corrective action, potentially opening the path toward the invalidation zone at $170.
Trade smart, Paradisers. This setup will reward only the disciplined.
MyCryptoParadise
iFeel the success🌴

Bitcoi 4 hour - Volatile Zone near bu = CAUTION
PA nearly at that Circle I posted
MACD near the Neutral line
Possible rejection from Both
Lets see how this plays out. I do ecpect PA to follow that arrow BUT Bulls could step in and take PA Above the upper trendline and then wait for the inflation data in the USA on the 11th
Watch BTC Dominance for Clues about how this all effects ALT coins

BTCUSD: H&S neckline invalidated! Heavily bullish.Bitcoin turned bullish again on its 1D technical outlook today (RSI = 58.910, MACD = 1101.600, ADX = 21.447) as it crossed over the neckling of the Head and Shoulders pattern and invalidated the bearish sentiment. This now targets the 2.0 Fibonacci extension to the upside on the short term, TP = 123,500.
## If you like our free content follow our profile to get more daily ideas. ##
## Comments and likes are greatly appreciated. ##

ALTCOINS made a 1D Golden Cross. First since U.S. elections.Crypto Total Market Cap just formed the first 1D Golden Cross ince November 6th 2024, which was right after the U.S. elections. The rally that followed made new highs. Since the Bear Cycle bottom, that is the 4th 1D Golden Cross and the minimum the market surged around such formation was +73.10%. This means that we can expected a 4.03T market cap at least.
## If you like our free content follow our profile to get more daily ideas. ##
## Comments and likes are greatly appreciated. ##

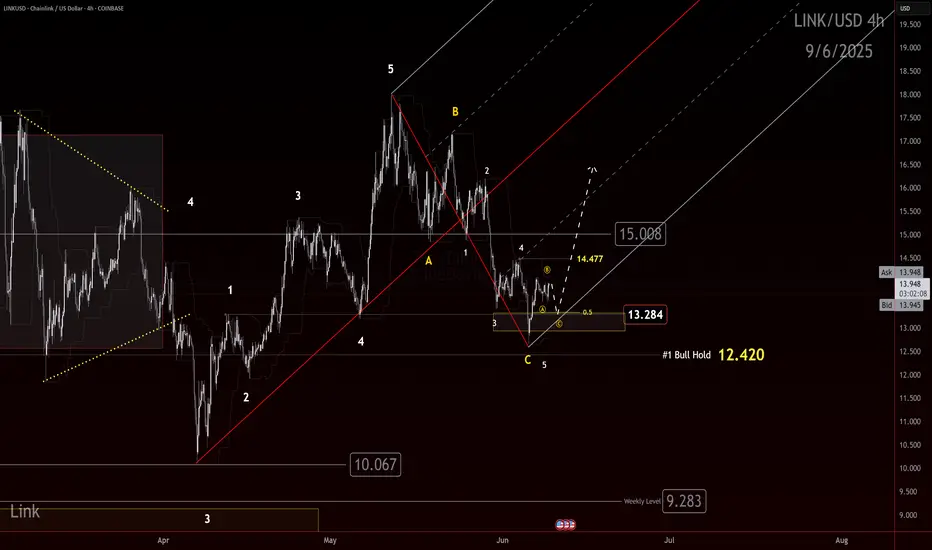
LINK Bulls Building Toward a Chain ReactionIf you find this information inspiring/helpful, please consider a boost and follow! Any questions or comments, please leave a comment!
LINK just gave us a clean reaction out of an identified box. Bulls may finally be gaining control and a trend shift up is on the table.
We had eyes on this box for a potential reaction. The market delivered. Now bulls need to prove they can build on it. The first key is to defend 13.284. As long as this level holds, the case for a higher trend remains alive.
Next, bulls need to clear 14.47. That is the first smaller degree LH that must be taken out to confirm that buyers are pushing through the structure.
The big step remains 15.00. This has acted as a major flipping level. A true test for the bulls will be whether they can reclaim and hold above it. If they do, the door opens for stronger upside follow through.
The path is clear:
💥 Hold 13.284
💥 Break 14.47
💥 Reclaim 15.00
We will continue to track this closely with the Elliott Scanner mindset. If momentum picks up through these levels, this could become an attractive higher-degree setup.
Watch these levels carefully. Bulls have work to do, but the ingredients for a shift are building.
Trade Safe!
Trade Clarity!
BITCOIN REVERSAL INCOMING !!!! BUT WHEN????Currently we have seen a great move from 75k to new ATH 112k BUT now whole bullish momentum seems to be fading.
If we see charts, we clearly see ranges and recently Bitcoin has swept range high & reclaimed back into range, which indicates lose momentum. We may see BTC tapping 90K even 80'sK for next bullish move.
For all to maintain it's bullish momentum, Bitcoin have to stay above 74.5k and needs to break and hold above 109.5K.
Breaking below 74.5k would push BTC as low as 60-55k
STAY CAUTIOUS !!!!

BTCUSD: Just hit the 1D MA50 and is rebounding.Bitcoin turned neutral on its 1D technical outlook (RSI = 51.000, MACD = 923.400, ADX = 25.014) as it hit its 1D MA50 for the first time since April 19th. That is a straight up buy signal, especially since the the current Channel Up with its 1D RSI HL structure, resembles September - December 2024. TP = 165,000.
## If you like our free content follow our profile to get more daily ideas. ##
## Comments and likes are greatly appreciated. ##

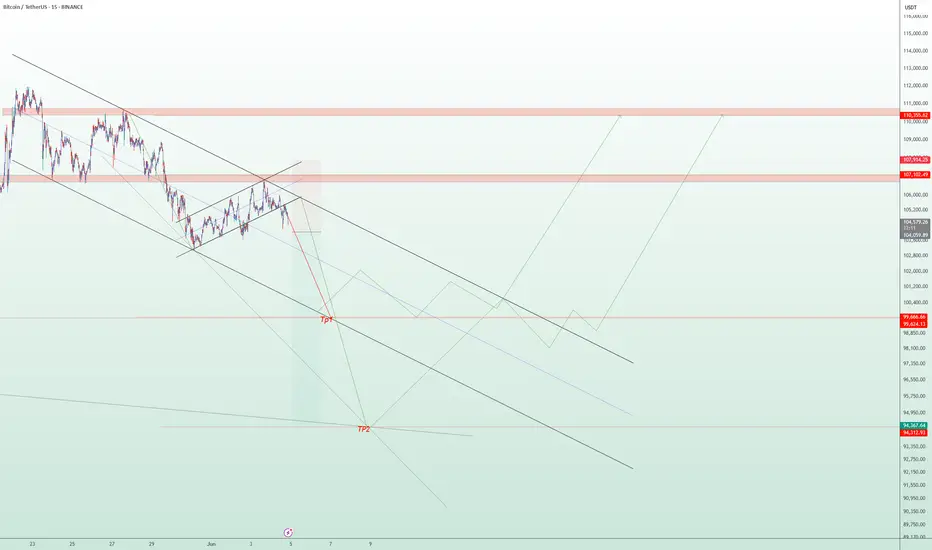
BTC/USDT Technical Analysis – 15-Min Chart | Short-Term Bearish The current price action of Bitcoin (BTC/USDT) shows a sustained bearish trend within a well-defined descending channel. Following a temporary bullish correction in the form of a rising channel, the price faced strong resistance around the $107,000–$110,500 supply zone and is now showing signs of a bearish breakout.
📉 Key Technical Observations:
A clear rejection from the upper resistance zone has led to a breakdown below the rising correction channel.
Immediate support zones are identified around $99,600 (TP1) and $94,300 (TP2), where price may potentially stabilize or bounce.
The bearish momentum remains dominant unless a strong reversal above $107,000 occurs.
📌 Scenarios to Watch:
Bearish Scenario: Price could continue falling toward TP1 and possibly TP2 if momentum holds and no strong reversal signals appear.
Bullish Reversal Scenario: A bounce from support levels with higher lows and a break above $107,000 could signal the beginning of a new bullish phase.
🔔 Disclaimer:
This analysis is intended for educational and informational purposes only. It is not financial advice. Please conduct your own research and risk assessment before making any trading decisions.
RENDER Is $1.366 the Next Stop Before a Major Market Reversal?Yello Paradisers! Are you prepared for the drop that could clean out both bulls and bears before the real move begins? Or will you be caught in another trap?
💎#RENDERUSDT has broken down from its ascending channel. This confirms that bullish momentum has faded, and the structure no longer supports higher prices.
💎The price is now trading below both the 50 EMA and 200 EMA on the daily timeframe. These are key trend indicators. Losing them shifts the bias to the downside. After rejection from the $5.00–$5.40 supply zone, the market failed to make a new high. That area remains strong resistance. Bulls must reclaim it to regain control.
💎Previous support around $4.00 has now turned into resistance. As long as price stays below this zone, lower targets remain in play.The next support is around $2.46, but that may only offer temporary relief. The real demand zone sits near $1.366, where stronger buying interest is expected.
💎Tether dominance (USDT.D) is showing early signs of risk-off behavior. It has reclaimed the 21, 50, and is now testing the 200 EMA at 4.88%. This suggests capital is rotating out of altcoins and into stablecoins.This shift is backed by rising volume. It's not retail noise it’s institutional positioning. The market is preparing for a deeper correction.
Stay disciplined. The next big opportunity will come to those who wait not those who chase.
MyCryptoParadise
iFeel the success🌴

XRPUSD: 5 month consolidation ends and targets $8.00 XRP has turned bearish on its 1D technical outlook (RSI = 41.730, MACD = -0.027, ADX = 31.602) as the price has failed to break above the very tight consolidation that started after January's High. This pattern is however very similar to the June - November 2017 consolidation, which was the last accumulation phase before the eventual January 2018 top of that Cycle. That was accomplished a little over the 1.382 Fibonacci extension. This indicates that we should stay bullish on XRP as it can target again the 1.382 Fib, TP = 8.000.
## If you like our free content follow our profile to get more daily ideas. ##
## Comments and likes are greatly appreciated. ##

LINK Long Setup – Retrace to Key Support After Strong RallyLINK saw a strong rally from April to mid-May, and is now undergoing a healthy retracement. Price is approaching the $13.00–$13.50 support zone, offering a potential long spot entry as the market cools.
📌 Trade Setup:
• Entry Zone: $13.00 – $13.50
• Take Profit Targets:
o 🥇 $15.00 – $16.00
o 🥈 $17.00 – $18.00
• Stop Loss: Daily close below $12.00

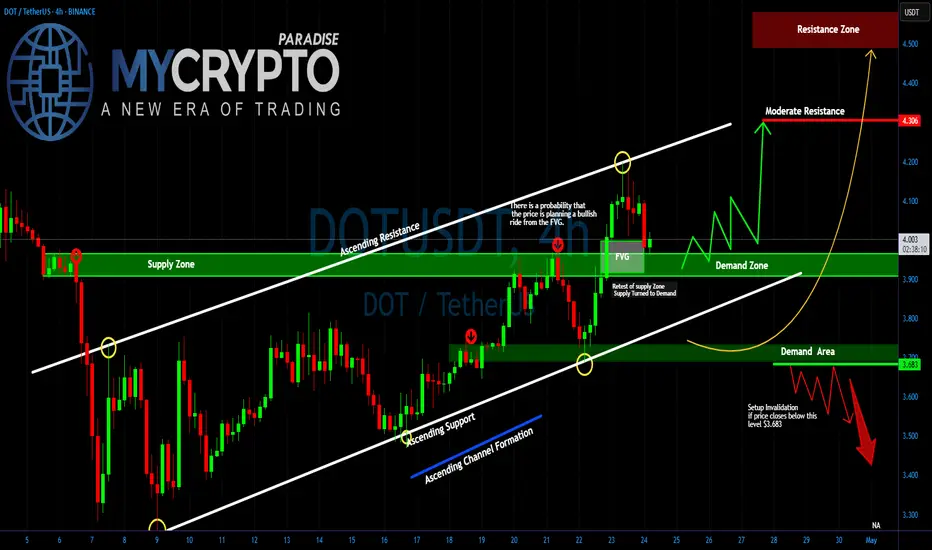
DOT/USDT About to Explode or Crash?Yello Paradisers! Are you ready for DOT's next explosive move, or will you be caught in the trap again? Right now, #DOTUSDT is sitting at a key decision point inside a textbook ascending channel — and what happens next could either print profits or wipe out the unprepared.
💎After respecting both the ascending resistance and support lines with high precision, it has now pulled back into a crucial area of interest: the Fair Value Gap (FVG). If DOT continues to hold above this level, the probability of a bullish continuation increases significantly. The area around $3.90–$3.95 is aligning perfectly with the demand zone, adding to the confluence and giving bulls a strong foundation to build on.
💎However, the real test lies ahead. POLKADOT must clear the immediate resistance around $4.10–$4.30 for the bullish momentum to gain traction. A successful break and retest of the $4.30 level would likely open the doors to a fast move toward the high-value resistance zone at $4.50 and above.
💎But here’s the twist: if DOT fails to defend the demand zone and instead closes below $3.683, the entire bullish setup becomes invalid. Such a breakdown could trigger a deeper correction, targeting the $3.40 region and possibly flushing out the overleveraged players in the process.
Stay focused, Paradisers. Be the hunter, not the hunted
MyCryptoParadise
iFeel the success🌴
ETH Weekly – Signs Aligning for a Long Setup
ETH is forming subtle higher lows above the 0.5 Fibonacci level and the 200MA—both sitting near the same key support zone.
The 50MA is currently acting as resistance, but structurally we’re seeing MLR > SMA > BB center, and the PSAR flipped bullish since the week of May 12.
We now have all the signals needed for a valid long entry on this timeframe.
Feel free to drop your thoughts in the comments—good or bad, all engagement is appreciated.
Take profits. Manage risk. Stay sharp.
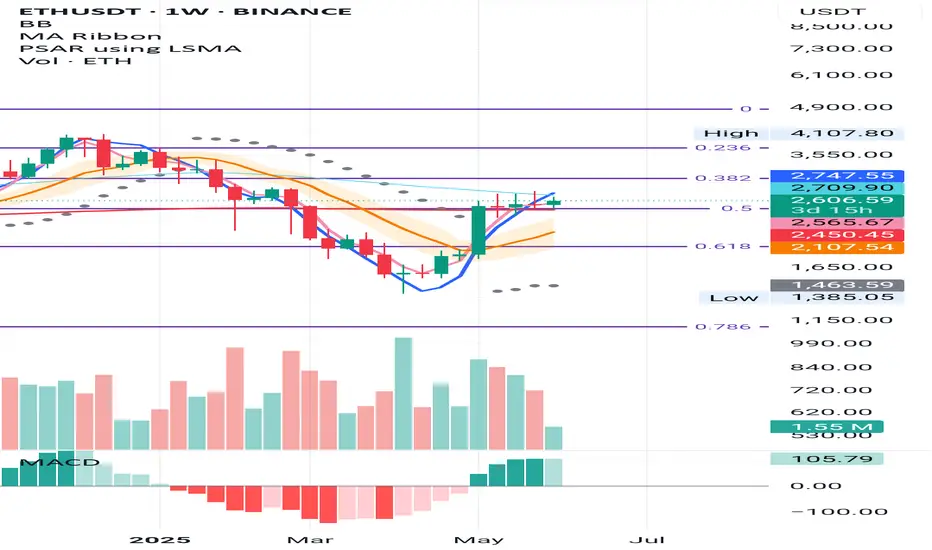
ETH Monthly – Fibonacci Structure in Play
ETH has been respecting the monthly Fibonacci levels with surprising precision.
There was a clear double top at the 0.236 Fib in May and November 2024, with a base forming at the 0.5 Fib. That same 0.5 Fib now acts as support, aligned with the 50MA.
The BB centre is currently stopping price, but for how long remains to be seen.
SMA is above MLR and rising, which supports a bullish bias.
If this structure holds, the next resistance zones may align with the higher Fib levels.
Feel free to drop your thoughts in the comments—good or bad, all engagement is appreciated.
Take profits. Manage risk. Stay sharp.

BTCUSD: Consolidation is about to be over.Bitcoin remains neutral on its 1D technical outlook (RSI = 52.429, MACD = 1547.600, ADX = 23.123) as so far it is failing to stage a proper breakout from the consolidation of the last few days. Based on the long term comparison with the previous Channel Up at the time of the 1D Golden Cross, the consolidation could be over soon, resembling November 4th 2024. As long as the 1D MA50 holds, stay bullish, TP = 165,000.
## If you like our free content follow our profile to get more daily ideas. ##
## Comments and likes are greatly appreciated. ##

AVAX Long Swing Setup – Retrace to Major Support in PlayAVAX is undergoing a healthy correction, setting up a potential swing opportunity as it approaches the $19.00–$20.00 support zone. This level has held as a key pivot in the past, and we’re now watching for bullish confirmation to enter long.
📌 Trade Setup:
• Entry Zone: $19.00 – $20.00
• Take Profit Targets:
o 🥇 $22.50 – $24.00
o 🥈 $27.00 – $29.00
• Stop Loss: Daily close below $17.80

Ethereum - The most important analysis for 2025!Ethereum - CRYPTO:ETHUSD - is clearly shifting bullish:
(click chart above to see the in depth analysis👆🏻)
After four years of trading, Ethereum is now sitting at the exact same level compared to mid 2021. However, Ethereum has been creating a significant triangle pattern and with the recent bullish price action, a breakout becomes more and more likely. Then, the sky is the limit.
Levels to watch: $4.000
Keep your long term vision!
Philip (BasicTrading)
