BTC 12H – Slightly Different Picture
The 12H chart tells a slightly different story.
From the PSAR point of view, price has tapped it twice, but that’s not enough for confirmation.
From the system perspective, price is trading above the BB center, with both MLR and SMA also above it—this could justify small scaling.
From the S/R view, price is currently testing weekly resistance and the dotted line marking the daily close. That’s a strong reason to apply proper risk management.
Let’s see how this unfolds.
Scaling in may be a valid option for those considering long exposure—if risk is managed properly.
Feel free to drop your thoughts in the comments—good or bad, all engagement is appreciated.
Take profits. Manage risk. Stay sharp.
Cryptotrading

BTC Daily – Mixed Signals, Patience Required
From the PSAR perspective, BTC remains in a bearish phase. We need to wait for a PSAR flip to green before considering new long entries.
From the second system view, we’re also still in bearish territory. The setup will shift once MLR crosses above the SMA and BB centre. Currently, price is holding the SMA as support and has paused at the BB centre.
Looking at S/R levels, we’ve seen a solid bounce from the 3D + 5D support and are now holding at the weekly support zone.
Let’s see how this unfolds.
Scaling in may be a valid option for those considering long exposure—if risk is managed properly.
Feel free to drop your thoughts in the comments—good or bad, all engagement is appreciated.
Take profits. Manage risk. Stay sharp.

PENDLE – Bullish Continuation Setup from Key Support ZonePENDLE remains one of the standout performers in the crypto space, maintaining its bullish market structure even amid broader market uncertainty. With price currently holding well above key support, this presents a favorable opportunity for a swing long position, especially if the broader market stabilizes.
📥 Entry Zone:
$3.50 – $4.30
🔹 Confluence with previous resistance turned support
🔹 Demand zone within bullish structure
🔹 Ideal for scaling in
🎯 Take Profit Targets:
🥇 $5.45
🥈 $6.30
🥉 $6.85
🛑 Stop Loss:
Daily close below $3.00
Structure breakdown

AVAX Bulls Walking into a Trap? Yello Paradisers, are we on the edge of a clean breakout or is AVAX setting up the perfect trap before flushing the late bulls?
💎#AVAXUSDT has recently broken above a critical resistance zone and is now attempting a retest. This move appears strong on the surface, but it sits at a dangerous pivot—one that could determine the short-term direction in the days ahead. The structure is unfolding within a clean ascending channel, with both resistance and support levels well respected. These rising boundaries give the breakout credibility, but they also highlight how vulnerable the setup is if key support levels fail.
💎Right now, the level that previously acted as resistance is being tested as support. This is the moment of truth. If the price continues to hold above this level with strength and volume, we’re likely in for a continuation toward the next resistance level around $22.40. But the real test for bulls will come at the $23.00 region, where heavy profit-taking and increased selling pressure are highly likely. That’s where the larger players will look to trap over-leveraged longs and reposition.
💎But this bullish outlook comes with a clear condition and it’s non-negotiable. If #AVAX fails to hold $21.00 and begins closing candles back inside the previous range, the move instantly loses its legitimacy. In that case, our focus turns to the strong demand zone between $20.20 and $20.40. A reaction from this area could still save the structure, offering a potential reload for a bounce. But if this level gives way, the entire bullish setup is invalidated and what was once a breakout turns into a confirmed bull trap.
Trade smart, Paradisers. This setup will reward only the disciplined.
MyCryptoParadise
iFeel the success🌴

Bitcoin Dominance, BTC ATH and ALT Seasons since 2017-some facts
There is little doubt now, that this Crypto cycle is very different from previous cycles and the main reason for this is the Bitcoin Dominance ( BTC.D) of the Market.
The reasons for this Dominance is complicated but we can certainly point towards the arrival of ETF's as one of the principle factors.
Corporations simply Buy Bitcoin, Hold it and Trade the ETF's - The Key Principle here being that the Coins are HELD Long term.
As we can see from the main chart, we have a key point in the BTC cycle called the Bitcoin Halving. To many extents, the explanation of this is not relevant right now.
But what you can see is how, previously, after the BTC Halving, we saw a drop in BTC.D,
This was due to the money Flow out of BTC and into ALT coins.
As more ALT coins were bought up, the demand drove the price higher and so their dominance increased, driving BTC.D down
This has not happened this cycle due to bulk buying of BTC for ETF's and BTC being Held Long term.
We can also see how , as we approached a certain time span After the Halving, we saw a sharp rise in BTC.D as we headed towards the next BTC ATH as the BTC buying picked up.
Again, this is not happening this cycle as the Bitcoins are being held long term.
What we can also see on the main chart is how we would normally be approaching a period of expected BTC ATH ( green vertical box )
And the HUGE question is, Will we get a Bitcoin ATH in this period ?
This is, to many extents, impossible to answer but as demand for Bitcoin continues and coins become harder to find, the price should continue to rise.
The tricky bit is, now, with a Bitcoin costing over 100K usd, it becomes harder to move the price. Only Corporations can afford to bulk buy.
So, again, things are different.. Retail is struggling to find a foot hold in the Bitcoin market, seeming to think that a Bitcoin is too expensive for them.....forgetting that they can buy a bit and that will also increase in price by the same %.
And so they look to the ALTs, fast volatile price rises and high returns,
This is seen very clearly in this chart that shows us when we had previous ALT seasons after the Halving
See how, after a period of time after Halving, the ALT Seasons appeared when the BTC.D dropped.
And that has simply just NOT happened this time.
It has to be said, it did try to appear. ALT season tried to happen.
See how after 210 days after halving this cycle, BTC.D did drop sharply but, it found a line of support and bounced back, Killing the ALT season dead in its tracks
There have been a lot of attempts since but the Market has been Bloody for ALTS, with sharp rise and Falls destroying confidence..... And Bitcoin continues to Rise.
So, where are we now ?
This Daily BTC.D chart may offer some ideas
BTC.D PA is currently at TOP of long Term range and finding it hard to get over that line of resistance.
BTC.D Weekly MACD , while not overbought, is curling over Bearish
BTC ATH's have previously been attained from Oversold areas as MACD Rose back higher.
The Volatility has gone and MACD is ranging smooth
SO, in conclusion, it is anybodies Guess right now if we will ever see an ALT season again.
Technically, on many fronts, we are poised, ready for it, even if it is a mini one.
But as we have seen on many occasions this cycle, Bitcoin is a very desired asset now and Demand drives price.....and so the Sell off that we need to drive an Alt season just may not occur.
One thing that is Absolutely certain though, we are highly likely to see another Bitcoin ATH
Stay safe everyone and Love one another. It is Free to do and is worth more than anything

BTCUSD: Neutral but long term still intact.Bitcoin has turned neutral on its 1D technical outlook (RSI = 50.968, MACD = 1795.700, ADX = 23.670) a direct consequence of last week's correction. That correction is though just a pullback on the 1W timeframe, which is more bullish than ever as it's coming off a May 1W MACD Bullish Cross. Since the 1W MA50 supported April's bottom and produced the current rebound (even ATH has been made) that also respected the powerful P1 trendline, this is a bullish wave similar to all prior since the late 2022 Bear Cycle bottom. As all 3 rallied by +100%, we can stay bullish aiming for 150,000 towards the end of the year.
## If you like our free content follow our profile to get more daily ideas. ##
## Comments and likes are greatly appreciated. ##

ETHUSDI am taking a long position on ETHUSD on FIB level 0.382-0.5 Retracement Entry Price will be 2520 with a SL of 2470 and TP of 2570

BTC 3D – Key S/R Level in PlayBTC is currently trading below the black line, which marks the double top support/resistance level on the 3D chart.
Tonight’s 3D candle close will be important:
🔻 A close below could open the way for more downside.
🔼 A close above might invite continuation—but neither outcome is guaranteed.
🎯 The best approach? Stick to the system.
Place orders just below the last PSAR, stay disciplined, and avoid emotional decisions.
✅ Always take profits.
✅ Always manage risk.
These are the only two things we can truly control.
Thanks for reading—and if you found this helpful, feel free to react or leave a comment!

BTCUSD: Neutral on 1D means buy opportunity during rallies.Bitcoin has turned neutral on its 1D technical outlook (RSI = 51.351, MACD = 2908.600, ADX = 27.535) which is far from alarming as during Bull Cycle rallies such pullbacks are buy opportunities. Especially now that the price is even supported by the 1D MA50, which having cross above the 1D MA200 last week, they formed a Golden Cross. The pattern is identical to the last 1D Golden Cross, steady rally phases supported by HL trendlines that rose by roughly the same percentage. Their 1D RSI sequences also display similar formations. For that reason, we remain bullish on Bitcoin despite the current correction, targeting short term 119,000.
## If you like our free content follow our profile to get more daily ideas. ##
## Comments and likes are greatly appreciated. ##

BITCOIN (BTCUSD): A Deeper Correction?!
After Bitcoin updated the All-Time High, the market became
weak and exhausted.
A violation of a support line of a rising channel and a breakout
of a key horizontal support indicate a highly probable continuation
of a correction.
Our closest demand zone is 103200. It can be the goal for the sellers for now.
❤️Please, support my work with like, thank you!❤️

BTCUSD: About to explode to 135k by July.Bitcoin is about to turn neutral again on its 1D technical outlook (RSI = 57.730, MACD = 3423.900, ADX = 23.501) as it is expreriencing the strongest pullback since the start of its April bottom. Having completed a 1D Golden Cross like on October 27th 2024, this pullback seems a lot like the one that suceeded that Cross, which tested the LH trendline and marginally crossed under it and as it held the 1D MA50, resumed the uptrend and exploded to the 3.382 Fibonacci extension. That is our target on a July horizon (TP = 135,000).
## If you like our free content follow our profile to get more daily ideas. ##
## Comments and likes are greatly appreciated. ##

BTCUSD Analysis – Mirror Market Concepts (MMC) Action + Target🧭 Mirror Market Concepts (MMC) Explained
Mirror Market Concepts analyze repeating emotional and structural patterns in the market—like looking at a price “mirror” that reflects past movements into the present. Core tools include:
Mind Curve Resistance/Support
CHoCH (Change of Character)
BOS (Break of Structure)
Price Reflection Zones
These tools let us understand not just what price is doing—but why it's reacting at specific levels.
📊 Technical Breakdown of the Chart
🔹 1. Black Mind Curve Support & Resistance
The chart is framed between a rising support curve and a descending resistance curve, forming a psychological squeeze zone.
These mind curves represent subconscious institutional memory—where reactions often repeat based on historical liquidity and risk-off/on behavior.
🔹 2. Major CHoCH (Change of Character)
Price broke below a previous minor higher low, shifting sentiment from bullish to neutral/bearish.
This CHoCH happened within the mind curve boundary, signaling that we’re transitioning into a decision phase.
🔹 3. Major BOS (Break of Structure)
The BOS occurred during the recent drop, confirming sellers took temporary control.
However, price respected the lower mind curve support, which may still hold as the "mirror zone."
🔹 4. Key Compression Pattern (MMC Symmetry)
Price is forming a symmetrical wedge between the two curves, often seen in MMC just before a major explosive move.
The pattern resembles past behavior where price compressed before breaking out in either direction.
🎯 Potential Scenarios (Plotted on Chart)
📈 Bullish Path:
If BTC breaks above the descending curve + confirms above 109,000, we may see:
✅ Target 1: 111,000 (BOS retest)
✅ Target 2: 112,500–113,000 zone (previous emotional high + liquidity sweep)
📉 Bearish Path:
A breakdown below 107,000 and curve support suggests sellers regain control:
⚠️ Target 1: 105,000 (local demand zone)
⚠️ Target 2: 102,500–103,000 (full MMC retrace)
⚠️ Watchlist Considerations:
Two key economic news events (highlighted on chart) could serve as catalysts.
Wait for confirmation and volume breakout before committing to either side.
This is a textbook MMC compression pattern, and patience is key before reacting.
🧠 What Makes This an MMC Setup?
🔄 Mirror Reflection of past rallies and drops forming current wedge
🧩 Mind Curve Boundaries acting like subconscious trend guides
🔁 CHoCH + BOS sequencing for momentum shift detection
💡 Psychological memory zones holding strong reactions
📌 Summary
BTC is caught in a psychological squeeze between mind curve support and resistance.
Structure favors a coming breakout or breakdown, but confirmation is critical.
MMC tools show a high-probability setup—either toward 112K or 103K based on where the breakout happens.
📣 Community CTA (Call-to-Action):
📊 How are you trading this BTC curve compression?
💬 Share your charts, setups, or alternate views below. Let’s decode the market mirror together.

BTCUSD: 1M turned overbought and that's not alarming at all! Bitcoin has turned bullish even on its 1M technical outlook (RSI = 70.030, MACD = 16,156.720, ADX = 38.100) but that's not a reason to expect any strong corrections as this is the part were it technically rises more during Bull Cycles. The basic structure of the Cycle is an Ascending Triangle which breaks when the parabolic rallies begin. Based on the ratio of the last two Cycles, the new rally should be around +130% from the top of the Ascending Triandle. That gives a $160,000 fair estimate as far as the Cycle top is concerned.
## If you like our free content follow our profile to get more daily ideas. ##
## Comments and likes are greatly appreciated. ##

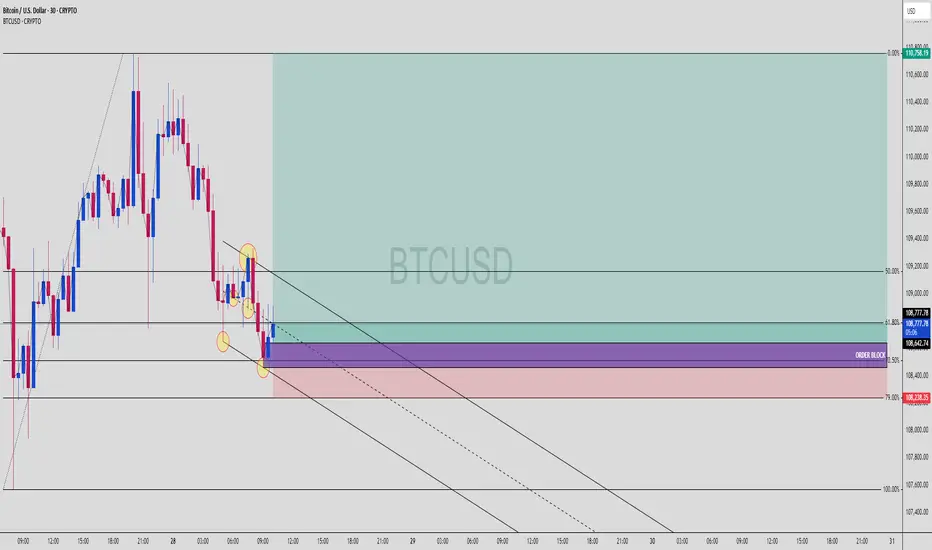
BTC Bulls Awakening from the Shadows – OB + 79% Fib Reaction 📈 BTCUSD | 30-Min Bullish Reversal Setup from OB + 79% Fib Zone
Smart Money never misses a good discount… and this BTCUSD setup is that juicy premium-to-discount play we wait for.
🔍 1. Price Action Context
Market sold off into a clearly defined Order Block
Price tapped precisely at the 79% Fib level
Internal liquidity sweep confirmed below recent equal lows
No candle close below OB = structure still intact
This is what we call the "Trap + Reverse" move. Late shorts just got baited.
🧱 2. Confluences Stacking Up
💎 79% Fib Retracement — Deep discount zone for Smart Money
💎 Bullish Order Block — Last up candle before the sharp sell-off
💎 Liquidity Sweep — Price swept short-term lows = inducement
💎 Channel Structure — Midline bounce = potential breakout
The OB + Fib overlap = a high-probability buy zone with minimal risk
🎯 3. Trade Plan
Entry Zone: 108,250–108,650
Stop Loss: Below 108,000
Take Profit: 110,758 (premium zone)
⚖️ 4. RRR (Risk-Reward Ratio)
📥 Entry: ~108,400
🔒 SL: 108,000
💰 TP: 110,758
✅ RRR ≈ 1:5.8
This is sniper-level asymmetric risk. You don’t chase candles — you wait here, like a lion in the grass 🦁.
🔁 5. What to Watch Next
Price must reclaim and close above 108,867 for confirmation
If we get a BOS (Break of Structure) above 109,200 = 🚀
Hold above the mid-channel line = bullish continuation
💬 Comment “LONGED BTC 💎” if you caught this with the OB bounce!
📌 Save this to study OB + Fib synergy.
👀 Watch price action at 109,200 — breakout zone incoming?
JUPUSDT Breakout... or Classic Bull Trap?Yello Paradisers are you truly prepared for one of the cleanest and most deceptive setups we've seen on JUPUSDT in weeks? A decisive move is building, but so is a very well-placed trap and only those who remain disciplined will navigate it safely.
💎#JUPUSDT has broken above a key resistance level that has rejected price action several times in the past. That same level is now being tested as support, and the market’s reaction here will be crucial. If this retest holds, we could see a continuation of the bullish structure with strong upward momentum. But this is precisely where many get caught assuming it’s a straightforward breakout, when in fact it could be the final bait before the flush.
💎The level at $0.5870 is now our line in the sand. If price remains above it, what we are witnessing is likely a healthy pause and consolidation before another impulsive leg upward. However, if $0.5870 fails, the next area of interest is the demand zone near $0.4718. A sharp move into this region could trap late bulls and shake out weak hands. The key will be whether buyers step in aggressively on that dip. A fast and strong rebound from the demand zone would confirm renewed strength, offering a potential high-probability long entry but only if the reaction is immediate and decisive.
💎To the upside, we are watching the moderate resistance around $0.7865, which could slow the move briefly. But the real game begins near the major supply zone at $0.8992. That’s where we expect smart money to begin unloading positions and anyone serious about preserving profits must be prepared to react accordingly.
💎However, if the price fails to hold even the demand zone and breaks below $0.4718, the entire bullish setup gets invalidated. That becomes our structural flip level, and if breached, we’ll turn bearish and prepare for further downside and potential lower lows.
Discipline, patience, robust strategies, and trading tactics are the only ways you can make it long-term in this market.
MyCryptoParadise
iFeel the success🌴

Ethereum - The bottom is finally in!Ethereum - CRYPTO:ETHUSD - is starting the rally:
(click chart above to see the in depth analysis👆🏻)
Finally, after dropping an expected -65% over the past couple of months, Ethereum is retesting and already rejecting a significant horizontal structure. Together with the strong confluence of support, Ethereum is now creating a long term bottom, initiating the next bullish cycle.
Levels to watch: $2.000, $4.000
Keep your long term vision!
Philip (BasicTrading)

Bitcoin Hits New All-Time Highs — Rally Targets $130K+Bullish Momentum Accelerates:
Bitcoin has reached new all-time highs, confirming a strongly bullish technical outlook. Accelerating upside momentum and growing investor confidence are driving the current rally.
Breakout Confirmation:
A decisive breakout from a broadening wedge pattern has unlocked potential targets in the $130,000–$135,000 range, signaling a likely continuation of the uptrend.
Key Support Levels:
With Bitcoin now trading well above $106,000, the previous resistance at $108,000 is expected to act as strong support during any pullbacks — providing a clear risk threshold for traders.
Favorable Risk-Reward Setup:
This alignment of:
Strong momentum
Completed consolidation
Successful breakout
...creates a compelling risk-reward scenario and reinforces the case for continued upside in the current bull cycle.
Bitcoin may just be getting started on its next leg higher. 🚀🔥
#Bitcoin #BTC #AllTimeHigh #Crypto #TechnicalAnalysis #Bullish #Breakout #MarketMomentum #CryptoTrading #CryptoMarket

ETHUSDETHUSD has printed potential HH so i will make a buy limit entry using FIB at 0.382 leve(2617) With SL of 2510 and TP 2724 the risk on this trade is 0.3%

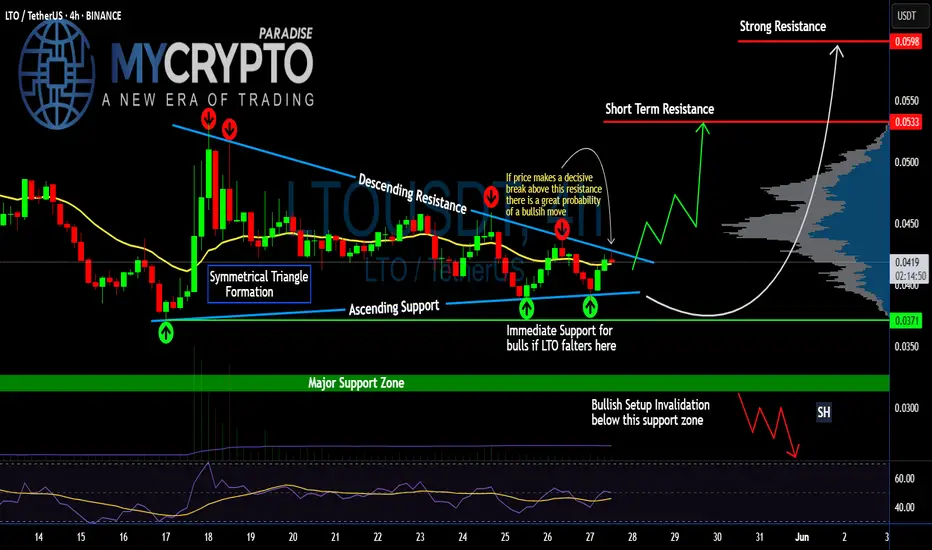
Is #LTO Ready for an Explosive Move or Another Trap Ahead? Yello Paradisers! Are you watching how #LTO is quietly tightening within a triangle while the rest of the market looks away? This might just be the last moment of silence for #LTONetwork:
💎#LTOUSDT is currently consolidating within a clean symmetrical triangle, wedged tightly between a descending resistance and an ascending support trendline. This pattern has already seen multiple touches on both edges, suggesting price is nearing the point of decision.
💎What makes this formation more compelling is how #LTOUSD is holding just above the immediate support at the $0.0371 zone and 20EMA is also acting as support. This area has acted as a launchpad twice already, keeping bullish hopes alive. Price is once again pressing against the upper boundary of the triangle, increasing the odds of a breakout on the next attempt.
💎If bulls manage to push above the descending resistance and we see a confirmed breakout with strong volume, the first upside target sits at $0.0533, which is a key short-term resistance level. From there, momentum could carry the price toward $0.0598, where a strong historical resistance lies based on the volume profile.
💎However, the bullish structure is clearly invalidated on a break below $0.0321. Any decisive move under this support zone would shift the short-term outlook in favor of the bears, potentially opening a path toward lower support.
Discipline, patience, robust strategies, and trading tactics are the only ways you can make it long-term in this market.
MyCryptoParadise
iFeel the success🌴
BTC Short Locked – FVG + 79% Fib = Liquidity Grab Incoming📉 BTCUSD | 1H Smart Money Short – Premium Rejection in Play
Bitcoin just tapped into a nasty supply zone that aligns with:
🟥 Fair Value Gap (FVG)
🔻 79% Fibonacci Retracement
💥 Previous Breaker Block Zone
🧠 Clean Internal Liquidity sweep
🚩 Structure still bearish – no HH
🔍 1. Market Structure Breakdown
Price broke down aggressively from the top (early signs of redistribution)
We’re now retesting the FVG + OB zone
No candle close above the Strong High = still valid bearish context
🧱 2. Zone Confluence
📍 FVG (Fair Value Gap): Imbalance created during impulsive sell-off
📍 OB + Breaker: Strong resistance holding inside 70.5%–79% retracement
📍 Strong High: Still protected
📍 Weak Low: Below = prime target for liquidity sweep
Price kissed the edge of that 79% Fib and immediately rejected = 🔥 confidence for a swing short
🎯 3. Trade Plan
Entry: Around 110,800 (inside FVG zone)
Stop Loss: Above 112,400 (Strong High)
Take Profit: 105,248 (below Weak Low liquidity)
⚖️ 4. RRR (Risk-Reward Ratio)
📥 Entry: 110,800
🔒 SL: 112,400
💰 TP: 105,248
✅ RRR ≈ 1:3.5
Solid asymmetric setup with clearly defined structure, inducement, and imbalance = Smart Money textbook trade.
📉 5. Why This Works
Retail longs are entering late = exit liquidity for big players
Price filled the FVG but failed to break structure
Weak low below is clean AF, likely to be swept for continuation
1H/4H alignment = high conviction short
💬 Type "SHORTED BTC 💥" if you saw this setup before the drop!
📌 Bookmark this – confluence stacking is how you win consistently
👊 Share this with someone still buying the top 📈🙃

BTCUSD: Urgently needs to break above this trendline!Bitcoin is bullish on its 1D technical outlook (RSI = 65.624, MACD = 4011.100, ADX = 25.476) but not overbought anymore as the aggressive weekly rallies since the 1W MA50 rebound have been decelerated. The next heavy obstacle is the HH trendline that runs on top of the January 20th 2025 and December 16th 2024 Highs and got hit last week. So far the price hasn't crossed above it but it needs to urgently in order to avoid a rejection with snowball effects.
The last time Bitcoin faced a similar HH trendline Resistance was on the October 23rd 2023 1W candle and it succesfully smashed through it, completing a +79.23% rise before consolidating again. If it breaks again above it, we expect the same minimum rally, which gives us a TP = 133,500.
## If you like our free content follow our profile to get more daily ideas. ##
## Comments and likes are greatly appreciated. ##

Bitcoin : Impulse up or Flat Trap!?If you find this information inspiring/helpful, please consider a boost and follow! Any questions or comments, please leave a comment!
BTC has staged a solid move off the May 25 low — but the context matters. We’re facing two distinct, high-stakes scenarios here: one bullish, one bearish. What happens next hinges on whether the May 25 rally is the start of a new impulse or the final leg (C wave) of an expanded flat off the all-time high.
Structure Breakdown
Bearish View: We’re completing a textbook expanded flat from the ATH:
A wave started May 23
B wave pushed to a lower low.
C wave began May 25 and is likely wrapping up now
If valid, this sets the stage for a powerful Wave 3 down.
Bullish View: The May 25 low marked the end of a corrective phase:
Rally from that low is an impulsive Wave 1
A pullback to the 108k golden zone would represent Wave 2
Wave 3/C up could follow from that base
What to Watch
The area around 108,000–107,100 is a magnet. If price retraces into this zone with a corrective look and holds, bulls could be in control. But if we roll over hard from here, it supports the expanded flat thesis — and a much deeper move likely follows.
Outlook
This is a moment for sharpen focus. The chart structure is clean, but the outcome isn't binary until we see what kind of retrace (if any) forms.
Watch 108k like a hawk. If bulls defend it, there’s room to talk new highs. If we break impulsively from here, expect acceleration lower — fast.
Trade safe, trade smart, trade clarity.

ADA Is Approaching a Trap Zone ? Yello Paradisers, are you watching how ADA is slowly coiling up near a crucial level while pretending nothing’s happening? Don’t be fooled — this is the calm before the storm, and the next move could wipe out the unprepared.
💎#ADAUSDT is currently respecting a well-established ascending channel. We’ve already seen three meaningful reactions at the ascending support, each triggering fresh bullish momentum. At the same time, the price is pressing just above a key demand zone around the $0.73–$0.74 region. This level remains absolutely critical for the bulls to defend if the structure is to remain intact.
💎What adds strength to this setup is #ADA’s current trading position above both the 50 EMA and 200 EMA on the daily timeframe. This reinforces the short-to-mid-term bullish bias. The 50 EMA is starting to slope upward, signaling that momentum could be gradually building, while the 200 EMA sits well below as solid structural support.
💎As long as the price continues to respect the ascending support line and stays above the demand zone, we expect a continuation move toward the $0.8728 moderate resistance. A successful break and close above that could open up the next leg toward $1.0011, where a strong supply zone sits waiting.
💎The real danger lies below $0.6495. A daily close under this level would not just invalidate the current setup it would completely shift market structure and expose ADA to deeper downside, likely towards the $0.60 area or lower.
Discipline, patience, robust strategies, and trading tactics are the only ways you can make it long-term in this market.
MyCryptoParadise
iFeel the success🌴
