Ethereum is about to accelerate its rise?Ethereum is about to accelerate its rise?
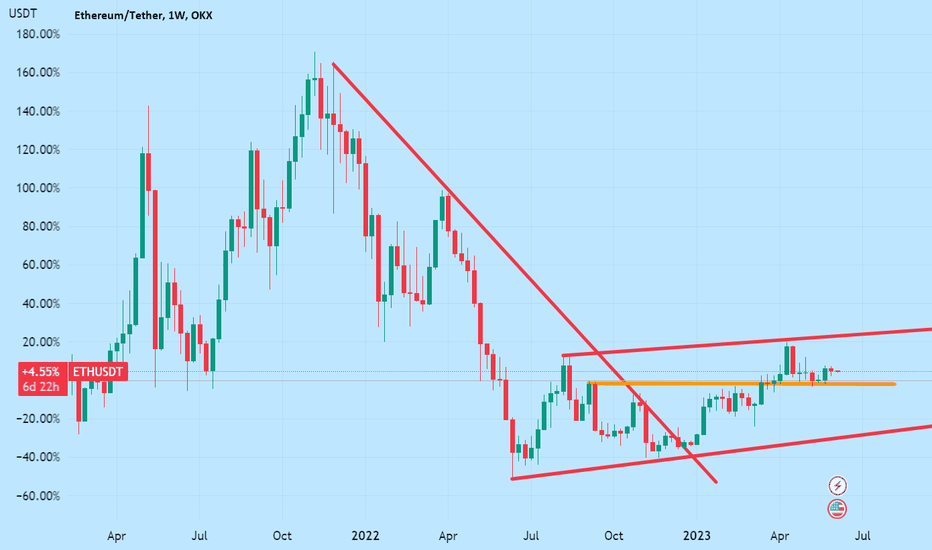
This figure shows the weekly candle chart of Ethereum for the past two years. The graph overlays the lines connecting the highs and lows of the past two years, the lines connecting the lows and lows, and the horizontal lines of recent key positions. As shown in the figure, after the shape of the head and shoulders of Ethereum is formed, the overall trend shows a slow upward oscillation with an angle of less than 15 degrees. Recently, Ethereum once again broke through and stepped back to confirm the short start position near 1751 before the shoulder position, and then began to steadily move up! In the future, Ethereum is likely to accelerate its rise and explore the upper edge of the upward channel line in the graph!
Cryptotradinng
BTCUSD, m15Intraday: We continue to watch BTCUSD. We corrected the markup after the price growth stopped at 19700, forming a five-wave impulse of a small wave (1). Small wave (2) completed the decline of $19250-19300. Small wave (3) will bring prices to $20400. Drop below $19100 cancels this scenario
REN/BTC - Nice position for recovery waveREN / BTC after increasing strongly to 0.00000880, immediately dropped to support 0.000005xx
The current position is quite nice, suitable for the recovery wave of REN
Buy zone: below 0.00000635
Target 1: 0.00000719
Target 2: 0.00000841
Stoploss: 0.00000550
** If you like our content follow our profile (www.tradingview.com) to get more daily ideas. **
Comments and likes are greatly appreciated.


