Let's clean out the weak handsThis bears will find no rest until we reach 5000. Breaking the 6500 support line seems to confirm this proposition. So what, let's do it than. This slow decline is getting boring anyway. Go on weak hands, sell it all! So that we can find peace and get to start working. Okay, what's my point? We'll go further down towards the 5000 marker, a previous all-time-high. We'll find strong support there and move sideways for some time. Than we'll push upwards, testing 10000 and probably getting rejected. Back down again towards 7500 or even 6500, taking a huge jump to break through the heavy 10000 resistance and testing 12000. After that? I have noooouuuu idea.
Crytocurrency

NANO coin dying out ? or the Best investment opportunity ?For Lazy and To the point Readers :
Nano ( XRB ) Trade Idea :
Long : 0.00050 or Below (Step buy orders)
Short : Step Sell orders
T1 : 0.00055
T2 : 0.00059
T3 : 0.00062
T4 : 0.00064++
Risk : Lowest ( Safest route Investment)
Term : Short / Mid ( Depending on the Total Market Volume)
Invest : 10% or more of Your Portfolio
Fundamental In-Depth Analysis :
Salient Features of Nano Coin:
This cryptocurrency comes with a significant number of very unique features that cannot be found in other digital currencies. Nano possesses an adroit development team that is constantly working on making these features even better for the Nano holders. Some of these features include:
Resolving Block Size Issue: Nano’s ingenious block lattice code has managed to nullify the block size issue completely. This issue is one of the principal reasons behind the sluggishness of Bitcoin’s transaction and its efficiency. With the block size problem eliminated, Nano’s blockchain ecosystem can offer tremendous scalability to its users.
Universal Blocks: In a blockchain system, blocks can be classified into four different categories namely receive blocks, send blocks, change blocks, and open blocks. In Nano’s platform, all these four blocks are combined into one single block with all the features remaining intact. These blocks are known as Universal Blocks. With the help of these blocks, Nano users can take advantage of a much efficient, convenient, and secure blockchain network. These Universal Blocks also provide all important data to the token holders as per requirement. Nano holders can know their individual balances without any hassle because of these highly efficient blocks.
Free Instantaneous Transaction: Nano coin was introduced to resolve Bitcoin’s scalability issue. Hence, it is of no surprise that Nano provides an instantaneous transaction facility to the traders across the globe. However, such a high-quality service comes completely free of cost. Also, the latency of Nano’s transaction system has also improved significantly over the past few mo0nths which allow the users to upload account chains anytime they want.
Recent Nano Coin Developments:
This currency has recently published an updated roadmap consisting of various goals and targets likely to be reached by the end of this year. The most significant Nano coin developments in progress include:
Nano Wallet: Nano’s development team has been working on releasing this wallet for a long time. The wallet is supposed to augment Nano coin’s efficiency and acceptability. Once the Nano wallet is launched, it would be compatible with iOS, Android, and Desktops.
New Block Explorer: A new block explorer of this coin is around the corner which would shift its base from nano.org to nanocode.co. This new explorer would enable users to monitor the live coin performance on a more user-friendly interface.
Nano Wat.ch Application: Once this application is launched, the holders of this digital currency would be able to see up to 50 recent Nano transactions to keep track of their payments.
Current Condition of Nano Coin:
As of 31st May 2018, Nano Coin holds the 34th position on Coinmarketcap with a market capitalization of 565 million USD and coin price of $4 approximately. In the past few days, Nano has managed a conspicuous upsurge in its price with a percentage of circa 3.5.
Final Thoughts:
RaiBlocks was rebranded to Nano in almost the same time of Bitcoin’s downfall and one simple change has transmogrified its position in the market. Nowadays, security and scalability are major issues that most cryptocurrencies are working on perfecting. As Nano has incorporated this feature from the very beginning, it serves as an extra advantage. With the new developments around the corner, Nano’s blockchain system is likely to become even more impregnable and efficient. it is safe to say that Nano will have great 2018 !

Bearish scenario for $BTCRising wedge on the daily so I've set a target equal to the size of the wedge itself (7%) which is drawn in as the rectangle. We had the same pattern play out on the 4hr yesterday which I think has only served to add confluence to this larger pattern. I'm trying not to be bias here, I know I've been bearish for a couple of weeks now but I personally can't see much for a bullish setup apart from a double bottom bounce off the marked 7270 support level. I'll update if that plays out and mark out some targets I would be looking for if I were to enter a long position.
Thanks for reading.
@cryptoisascam

looking quite bearish! bulls not enough strong?hi traders! we are seeing how didn't managed to break that resistance which indicates bulls are weakening. To really see a big movement upwards we must see how bulls break that resistance and starts consolidating that movement.
Meanwhile, we are seeing some bearish signs which indicate that the price is set to retrace if bulls don't manage the situation:
- Bearish divergence found on the RSI, which is very visible below the 2 hour chart.
- Descending volume, which indicates the lack of momentum of the bulls.
- Rising wedge, which is the most bearish sign of all 3 and indicates reversal. we can confirm this pattern as the volume has been descending since the price has been rising and the wedge evolving.
if you are going to take action on this trade, you should look at the volume when the price breaks the wedge downwards to make sure the trade.
happy trading guys! BITFINEX:BTCUSD

ETHBTC have a Bullish shark plotted on H4, What's your move?HI, I hope everyone is doing well.
as the start of this week is really depressing for cryptos as every major coin is suffering at the moment and it's quit hard to just
rely on the Technical side of these assets so just keep in mind that the risk is a little high while we try to go long on them,
but it's really interesting to know what our technicals has to say about ETHBTC where we can get a short bullish swing
First analyzing 240M Chart and we got,
1. HARMONIC PATTERN - BULLISH SHARK Identified on 240M Chart
2. 0.070000 consist of Demand Zone
3. Dynamic Support at 0.070455
4. OVERSOLD Indication by RSI and CMO
5. Fibonacci Gird Level 1.618 plotting near our Buying area
also on daily chart, Price is been Hold by 200Day WMA.
and hence everything looks great
Technical - Strong Bullish
Fundamentals - NILL
Market Condition - Bearish for Asset Type -III
Conclusion - Bullish for Short Term!
If you find my trading Ideas helpful then leave a LIKE
and Feel free to comment your thoughts,
- Lewis (CryptoLover)

BTCUSD Bitcoin Update - LongsLongs playing out from WK demand I have been pointing out for a long time.
I am long from WK demand on BTCUSD and other crypto's, looking like we could be seeing price reacting to the longer term MN and WK trend.
Long bias for sure, no shorts.
Happy Friday all, have a great weekend!

Peercoin PPC bullish stanceWe have been watching Peercoin for some time now, We are surveying this coin for our own personal reference guide, but please feel free to also utilize it for your personal reference as well, but we are not financial advisers and this is not investment advice. so be sure to check as well and do your own ongoing research if this project interests you as it did us.

Bitcoin Bear Trap Surge_Update 3The Bitcoin and pretty much all cryptos experienced an explosion of an upswing on Thursday, April 12, with granddaddy coin jumping more than $1,000 to break $8,000 level about a half hour period. My take on this is the sudden surge was as a “Bear Trap”: And unfortunately out stop has been triggered.

#Bitcoin Bear Flag or Weekend Nonsense?See previous postings for my take on this #btc_usd #btcusd #bitcoin #crypto

ETHUSD presents a good r/r entry point if price consolidates$400 is a strong hold for ETHUSD which is in oversold territory. This might present a good entry point for the patient investors.

GBPJPY approaching support, potential rise! GBJPY is approaching our first support at 147.90 (horizontal overlap support, 100% Fibonacci extension, 76.4% Fibonacci retracement, Elliot wave structure) which coincides with our short term ascending support line. A strong bounce might occur at this level, pushing price up to our major resistance at 149.30 (61.8% Fibonacci retracement, horizontal overlap resistance).
Stochastic (55,5,3) is also approaching our major support level at 8%, a good precursor for a potential bounce in price should it bounce off this level.
Losses can exceed the initial investment so please ensure you fully understand the risks Trading CFDs on margin carries high risk.

BTC Dual Cipher Patterns Completing?+Dual Cipher patterns that are near the same when terminating at long term support line tested at 5850 and 7200.
+RSI has 20 more points to drop before aligning with prior bounce level.
+Stock RSI showing (very) short term reverse (but continuation of longer term) based on prior bounce levels.
Bearish channel
+Wedge completion at second cipher completion. Down or up?
Not advice, just connecting dots.


Bitcoin with upward bias and new price channel ?Chart ready for the week ahead, and end of the march.


EURUSD approaching its support, potential for a bounce!EURUSD approaching its support at 1.2260 (61.8% Fibonacci retracement , horizontal overlap support). We have also identified an impulsive Elliot Wave , where price could potentially rise to its 1st resistance at 1.2346 (horizontal pullback resistance) or if it breaks past this level, could potentially rise further to its 2nd resistance at 1.2411 (horizontal swing high resistance). We have also identified another support at 1.2221 (76.4% Fibonacci retracement ).
Stochastic (55, 5, 3) shows it approaching its support at 2.47% where a corresponding reaction could occur.

Neo/Btc Flag pattern going to upNeo breaks up the resistant line and it made flag pattern. According to flag pattern, it will go until 0.009432 on Neo/Btc chart.


BTC ranging and searching for recoveryobserving a fair amount of selling/resistance going on at this 9,300 zone. It seems if we break below 8100 it'll be a quick free fall to the lower levels. However, also noticing the flat cloud at 10,400. It seems most probable that price will get sucked up to that region as it 'reverts to the mean'. Holding BTC for the moment and watching for invalidation if we break for a lower low on good volume

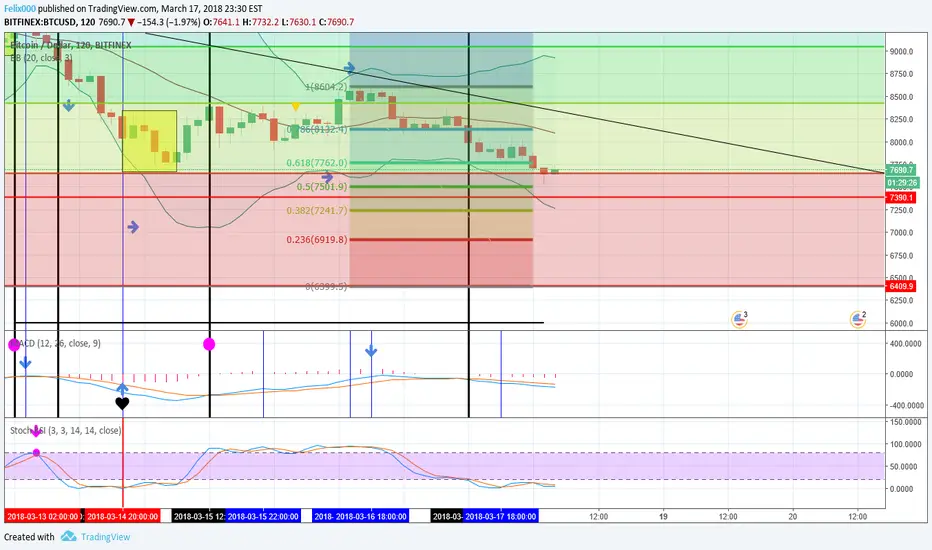
Death of the Bears. Worst case scenario Y/NI believe my forecast posted in the 4 hour chart of min $6,399 will hold a closing 2 hour candlestick or 4 hour candlestick above this min. I don't think my other forecast posted with the 4 hour chart of $7,384 will (see posting of 4 hour chart for how I arrived at these calculations). The Fib lines I've inserted appear to be working well which I think gives credence to this worst case scenario. If you check out my last posting "Bitcoin GPS where are we ? " it's my best and most colourful ever and includes how all my other ideas have been doing on 4 hour chart. My most recent worst mistake was going bull with stop at $8,150, and getting caught in a bear trap. Can't win all the time.

BTC: 12pm EST Dump Coordination - Decreasing Volume The last three days seem to have been coordinated BTC dumps that have occurred at 12pm EST. The BTC downward momentum this past week may be an isolated incident caused by a single actor (Mt. Gox trustee?) that has now lost its momentum.
The good news is that the volume appears to be decreasing each day. The bears seem to be losing momentum which is good news for the BTC Bulls.
I would not be surprised to see a green weekend with BTC heading back towards $10k or higher.
(This analysis was brought to my attention by @chartmandan w/ The Chart Guys)

(PATIENCE) LONG LIVE THE KING..........THEY SAY......the STOCH RSI says that the this is going to go up, but when??? if you check the resistence (red box), this is goin to stop at 7k.
this is a 1d chart this is going to be in about 4 days, buy weekends is always slow so, lets see.....
just be patience, DO NOT PANIC, i think we are still with a lot of 90 rule pleople from the december party (20k btc).
BTC IS GOIN TO RULE THE WORLD. LONG LIVE THE KING.
THEY SAY.......
