Bitcoin bouncing off major support,remain bullish for correctionBuy above 10332. Stop loss at 7902. Take profit at 12808 and 14497.
Reason for the trading strategy (fundamentally):
Price has dropped strongly amid concerns in Asia as investors still keep an eye out on the crackdown in Korea. Most recently a senior official at the People’s Bank of China is reportedly calling for a wider ban on services related to cryptocurrency trading in the country. The goal is to end all cryptocurrency trading-related activities and services. This has rattled the market strongly leading to its sell off.
Reason for the trading strategy (technically):
Price has dropped strongly since yesterday and we’re seeing that price has bounced off major support at 10332 (ABC Fibonacci extension, long term 50% Fibonacci retracement) and we expect an intermediate corrective bounce from here. Our first target would be 12808 (38.2% Fibonacci retracement, horizontal pullback resistance, breakout level) before 14497 (Fibonacci retracement, horizontal swing high resistance).
Stochastic (34,5,3) is seeing major support above 12% where we expect a corresponding bounce from.
Crytocurrency
Litecoin on major support, prepare for a potential bounce!
Litecoin is seeing major support above 222.06 (horizontal swing low support, bullish divergence, Fibonacci retracement) and a strong bounce could occur at this level to push price up towards 244.57 resistance (50% Fibonacci retracement, horizontal swing high resistance).
Stochastic (34,5,3) is seeing major support above 3.6% and also sees bullish divergence vs price signaling that a potential reversal could be impending.
Trading CFDs on margin carries high risk.
Losses can exceed the initial investment so please ensure you fully understand the risks.
Bitcoin profit target reached perfectly, prepare for a bounceBuy above 12858. Stop loss at 12348. Take profit at 13748.
Reason for the trading strategy (fundamentally):
Price has continued to tumble with South Korean cryptocurrency investors facing fines if they have anonymous accounts, along with that, the justice minister aired a plan to ban trading at cryptocurrency exchanges. To add fuel to fire, the Indonesia Central Bank has also warned that cryptocurrencies may not be used for payments in the country. These influx of bad news surrounding bitcoin has caused it to fall even further.
Reason for the trading strategy (technically):
Price has reached our selling area and dropped down perfectly to our profit target. We look to play another bounce above 12858 support (ABC Fibonacci extension, horizontal swing low support) towards our resistance target at 13748 (Fibonacci retracement, breakout level).
Stochastic (34,5,3) is seeing major support above 10% where a corresponding bounce could occur.
Bitcoin profit target reached perfectly, prepare for a dropSell below 13995. Stop loss at 14690. Take profit at 12948.
Reason for the trading strategy (fundamentally):
Price has continued to experience bearish pressure especially with a lot of investors’ eyes on the South Korean government plans to close the country’s cryptocurrency exchanges along with the tax authorities investing some of the exchanges in Korea. Some banks, including South Korea’s largest bank, Shinhan Bank, have decided to close down their virtual currency accounts in order to comply with new regulations surrounding their use. This has led to the spooking of many Bitcoin investors.
Reason for the trading strategy (technically):
Price has bounce from our buying entry perfectly and has reached our profit target. We look to sell below 13995 resistance (Fibonacci retracement, horizontal pullback resistance, breakout level) for a push down to at least 12948 support (Fibonacci retracement, horizontal swing low support, Fibonacci extension).
Stochastic (21,5,3) is seeing major resistance below 92% where we expect a strong reaction from.
BTC Correction or Crash ..Only Time Will Tell !!analyzing the two crashes back in 2013 they almost have identical patterns in every aspect..intitial panick dip then a fake breakout (bull trap) spend time sideways along the 50 MA until then final dip and a breakout.
it is almost impossible to distinguish the two cases at that time and to decide whether we are in a deep correction or already entered a bear market..
it looks like we are facing the same situation today..so we only have one choice and that is to Hodl and add on the dips.
HSR | Hshare will move up HSR will up with support XABCD,Triangle Pattern and MACD
Buy order : 1320
Profit Target : 1400 - 1560 - 1740 - 1900 - 2100 - 2300
STOP LOSS : 1140
Good luck everyone
Bitcoin on major support, time to play an intermediate bounceBuy above 12948. Stop loss at 11965. Take profit at 14250.
Reason for the trading strategy (fundamentally):
Investors are getting spooked especially with news that South Korea might potentially ban the trading of cryptocurrencies via exchanges in the nation. This is largely due to the Korean government mulling its options for curbing what is seen as excessive speculation in the crypto markets. They have even raided bitcoin exchanges such as Bithumb and Coinone with police and tax office officials recently amid investigations into tax evasion. All this has led to the shaking of investor’s confidence and hence the price decline.
Reason for the trading strategy (technically):
Price has continued to drop strongly and is now testing major support at 12948 (Fibonacci extension, horizontal swing low support) and a bounce could occur at this level to pose a temporary recovery to at least 14250 resistance (Fibonacci retracement, horizontal overlap resistance).
Stochastic (34,5,3) is seeing major support at 9.7% where a corresponding bounce could occur.
Bitcoin profit target reached, prepare for another bounceBuy above 14126. Stop loss at 13247. Take profit at 15391.
Reason for the trading strategy (fundamentally):
Bitcoin has been dropping strongly largely due to an SEC pushback that has led to several ETF proposals being withdrawn. There were several firms which were looking to list ETFs tied to bitcoin but the SEC “expressed concerns regarding the liquidity and valuation of the underlying instruments”. This has shaken the confidence of bitcoin investors which has led to the recent decline.
Reason for the trading strategy (technically):
Price has shot up and reached our profit target perfectly below dropping down once again as expected. We look to buy above major support at 14126 (Fibonacci retracement, horizontal overlap support, bullish divergence) for a bounce up to at least 15391 resistance (Fibonacci retracement, horizontal overlap resistance).
RSI (34) sees strong bullish divergence vs price and is a good signal that we’ll be seeing a strong bounce from here.
Litecoin above major support, watch for the break down.
Litecoin is holding well above our ascending support line. The key idea is to wait for the break of major support at 249 (ascending support, horizontal overlap support) and this could trigger a bearish exit towards 223 support (Fibonacci retracement, elliott wave projection, horizontal swing low support).
Stochastic (34,5,3) is seeing major resistance below 96% where a potential corresponding drop could occur.
Trading CFDs on margin carries high risk.
Losses can exceed the initial investment so please ensure you fully understand the risks.
Bitcoin reversing nicely, watch for break of ascending support!Bitcoin is testing major resistance at 15194 (61.8% Fibonacci retracement, 100% Fibonacci extension, horizontal swing high resistance, bearish divergence) and we can see that there is a strong ascending trend line support that is squeezing recent price action. A break is likely to occur soon and we would increase our conviction of a potential drop if price closes strongly below our ascending support line. Next major level of support is at 12915 (Fibonacci retracement, horizontal swing low support).
RSI (34) has made a bearish exit signaling as a precursor to the potential drop on Bitcoin.
Trading CFDs on margin carries high risk.
Losses can exceed the initial investment so please ensure you fully understand the risks.
Bitcoin continues to test major resistance, remain bearishSell below 15016. Stop loss at 15791. Take profit at 12908.
Reason for the trading strategy (technically):
Price continues to test our major resistance area at 15016 (Fibonacci retracement, Fibonacci extension, bearish bat harmonic formation) and we expect a drop from this level to at least 12908 support (Fibonacci retracement, horizontal swing low support).
Stochastic (34,5,3) is starting to drop nicely from our 94% resistance level and we expect it to drop further with price here.
KOMODO | 100% + PROFIT | HIM GO UPKMD -2.26% can go up with support XABCD , Triangle Pattern and RSI
Buy order : 73000
Profit Target : 84000 - 96000 - 108000 - 120000
Stop loss : 6000
Good luck
Chainlink (link) Maybe on the move soonChainlink (LINK) Has broken above resistance on pretty decent volume. More importantly, the pullback was on much lower volume showing people with strong hands are holding on.
Old resistance area was tested and is now new support. Add to this a great team with great project and a
move maybe imminent.... few days to month. Much depends on overall crypto market as well. Could be one of the big ones.
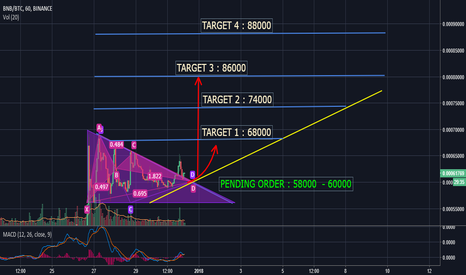
ETHLEND [LEND] NEW ALTCOIN LEND WILL UP WITH SUPPORT TRIANGLE PATTERN , MACD
PENDING ORDER : 1200 - 1250
SELL : 1780 - 2200 - 2900
STOP LOSS : 840
GOOD LUCK
Bitcoin testing major support, remain bullishBuy above 15456. Stop loss at 13906. Take profit at 17960.
Reason for the trading strategy (technically):
Price is now back to testing our major support area once again. We remain bullish looking to buy above major support at 15456 (Fibonacci retracement, horizontal overlap support, bullish price action) for a further bounce up to test the 17960resistance again (Fibonacci retracement, horizontal overlap resistance).
R eason for the trading strategy (fundamentally):
We’re starting to see bitcoin take quite a beating recently. This is largely due to the negative news surrounding it, especially those long-unresolved problems with Bitcoin’s infrastructure. Bitcoin buyers are running into problems where the network’s really high transaction fees make it unusable for purchases in reality and Coinbase has halted trading in Bitcoin Cash over concerns that the exchanges’ employees may have engaged in insider trading. All these are seeming to shake up investor’s confidence quite a bit.
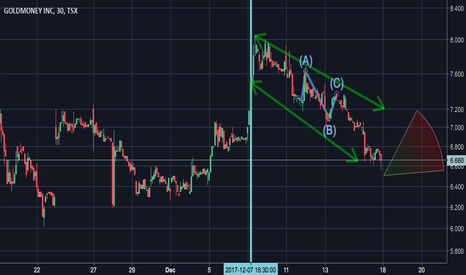
Bearish Flag Pattern Elliot Correction for GoldMoneyGoldmoney provides an excellent solution to its customers. The stock took off ever since introducing Bitcoin into it as an asset. It is safe to say that Goldmoney offers exceptional products. Although a bearish flag pattern has emerged since the beginning of December 2017, I see the company doing well into next year. As well as its stock price. A small correction appears to accompany the emerged flag pattern. Price at $9-12$ by February.
Another Data Breakout?RSI is still bullish! I'm thinking it will consolidate for a little bit, and visit a few support levels first, then breakout. If it breaks down expect the trend line.
Here's what it looks like against BTC:
Cheers and GLWT!
-Erik
ETHUSD $700 I still see Bull in ETH 3 scenarios. To go to $700 these 3 scenarios should be in play.
It tested high for a few minutes last night only to fall off when BTC falls heavily. What I see from TA now 415 is an attractive buy if you think this coin will still run (base on information, technologies, applications etc) Its a Bullish flag formation where it can run to 600-700 in a month time.


