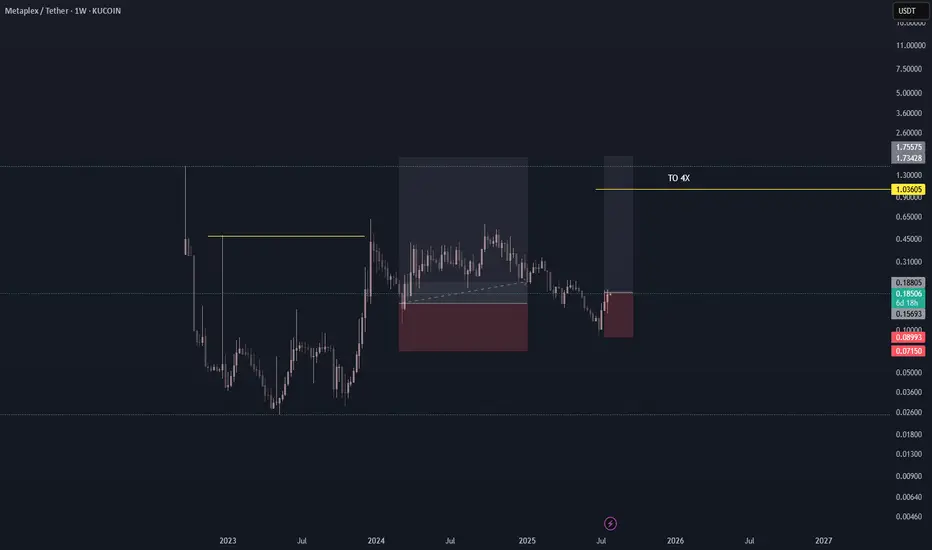
METAPLX/USDT BUY LONG FOR 4XCRYPTO - METAPLEX/USDT
EXPECTED RETURN TO 400-500%
** Crypto investing is highly volatile, you may lose all invested money, please keep it in mind and invest what you can lose and be ok.**
Crytpocurrency
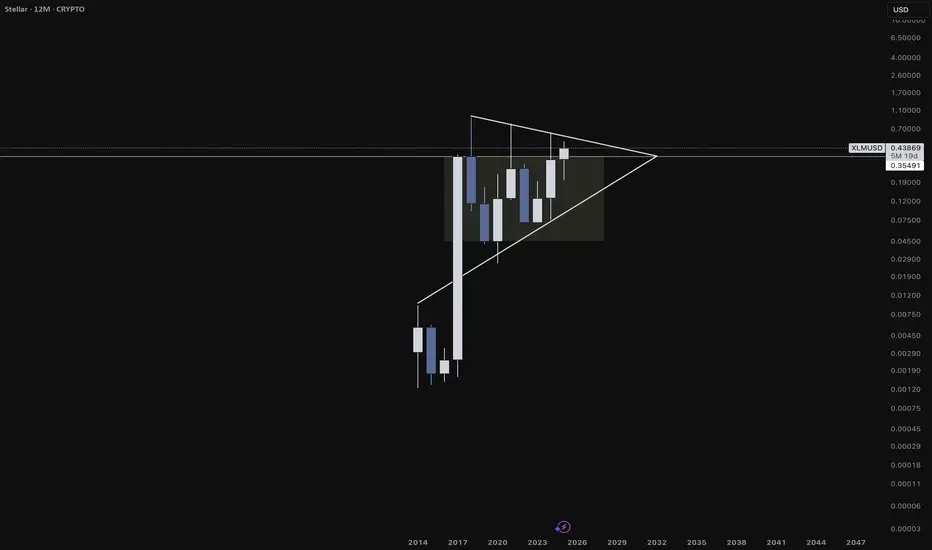
Here's Why XLM is on the Verge of a Massive breakoutThe next 10 years of success for the Stellar Network (XLM) are being shaped by decisions, developments, and trends happening right now (2024–2025). Here’s a breakdown of the long-term shaping factors currently in motion that will influence Stellar's trajectory through 2035:
------------
🌍 1. Real-World Use Cases Being Built Now
Stellar is not waiting for hypothetical adoption — it’s already deploying use cases that are foundational to its future success.
Examples:
MoneyGram Access gives real people the ability to cash in/out of crypto in over 180 countries.
USDC on Stellar enables stablecoin remittances with instant settlement and low fees.
Stellar Aid Assist provides governments and NGOs a working model for humanitarian digital cash aid.
Long-Term Impact: Building trust and infrastructure in the real world now means exponential network effects later — especially in emerging markets where crypto utility > speculation.
-------------------------------------------------------------------------------------------
🛠️ 2. Soroban (Smart Contracts) Rollout
Stellar is rolling out Soroban, a Rust-based smart contract platform that will transform the network into a programmable blockchain.
Why Soroban is Important:
Enables DeFi, lending, NFTs, on-chain identity, and DAOs.
Designed for predictable gas fees, making it ideal for finance and compliance.
Makes Stellar more competitive with Ethereum, Solana, Avalanche, etc.
Long-Term Impact: Soroban turns Stellar into a platform where real, decentralized applications can live — critical for long-term value capture and developer retention.
-------------------------------------------------------------------------------------------
🌐 3. Laying Global Payment Infrastructure
Stellar is quietly building global payment rails through partnerships with:
Fintechs (MoneyGram, Leaf, Settle, Cowrie)
Stablecoin issuers (Circle for USDC, Novatti for AUDC)
Payment aggregators in Africa, Latin America, Southeast Asia
Long-Term Impact: By 2030, these partnerships could evolve into a globally interconnected network of on/off ramps, anchors, and stablecoins. This gives Stellar real utility far beyond speculation.
-------------------------------------------------------------------------------------------
🏛️ 4. Regulatory Alignment & Compliance Tooling
The Stellar Development Foundation (SDF) is heavily involved in regulatory dialogue, including:
Working with the BIS Innovation Hub and IMF working groups
Building on-chain compliance tools (e.g. KYC/AML anchor guidelines)
Developing the Stellar Disbursement Platform, which complies with aid distribution requirements
Long-Term Impact: As crypto becomes more regulated, networks that built with compliance in mind will thrive. Stellar is positioning itself as a compliant blockchain for finance, especially for governments and NGOs.
-------------------------------------------------------------------------------------------
💸 5. Tokenization of Real-World Assets (RWAs)
The future of blockchain is heading toward tokenizing everything — and Stellar is already positioning itself at the front of that movement.
Franklin Templeton tokenized a U.S. mutual fund on Stellar.
Stablecoins like USDC and native fiat tokens are in active use.
Discussions are ongoing around CBDC pilots and tokenized bonds.
Long-Term Impact: The network that supports the most trusted tokenized assets — from CBDCs to real estate to securities — will gain enormous value from volume and liquidity. Stellar is in that conversation now.
-------------------------------------------------------------------------------------------
🧠 6. Mission-Aligned Ecosystem Funding
The Stellar Development Foundation holds billions of dollars in XLM and is using it to:
Fund early-stage startups building on Stellar
Run accelerator programs and hackathons
Expand into new regional markets (Africa, Asia, LATAM)
Long-Term Impact: Unlike many ecosystems that fizzle due to lack of funding or misaligned VC interests, Stellar has long-term strategic capital to guide the network toward its mission of financial access.
-------------------------------------------------------------------------------------------
🔐 7. Security, Speed, and Simplicity
From day one, Stellar has prioritized:
Fast block finality (~5 seconds)
Very low fees (< $0.001)
Energy-efficient consensus (SCP – Stellar Consensus Protocol)
These strengths are especially important for high-volume, low-margin applications like:
Micropayments
Remittances
Real-time settlements
Tokenized wages and aid
Long-Term Impact: As the blockchain infrastructure layer for finance matures, efficient networks will dominate. Stellar’s technical foundation makes it a sustainable long-term option.
-------------------------------------------------------------------------------------------
🧭 8. Stellar’s Focused, Long-Term Vision
SDF’s mission isn’t to be “just another smart contract chain” — it’s to improve access to equitable financial services, especially in underbanked regions.
That vision is:
Clear
Consistent
Attractive to partners, governments, and NGOs
Long-Term Impact: Clarity of mission = better talent, partners, funding, and resilience during market cycles.
-------------------------------------------------------------------------------------------
Chainlink Price on 14/June/2025Chainlink is trading at 13.25$ as of 14/June/2025. In Next week, It need to retest at 12.4$ -12.6$ before it break 15.51$. To claim the bull the price should be 20$.

TONUSDT Forming Falling Wedge TONUSDT is currently forming a classic falling wedge pattern—a historically bullish setup that often precedes major price breakouts. The recent breakout from the wedge accompanied by a significant surge in volume indicates a shift in market sentiment. This pattern suggests the end of a downtrend and the beginning of a new bullish wave. Such formations often result in strong upward price action once the resistance trendline is broken with volume confirmation.
Market participants have shown renewed interest in TON, with price currently stabilizing above a previous key resistance level, now potentially acting as support. This shift aligns with the historical behavior of wedge breakouts, where the asset consolidates briefly before continuing its climb. The current structure and momentum signal a potential 90% to 100% price appreciation, especially as investors recognize the strength of the breakout and the fundamental developments behind the project.
The volume profile further supports this bullish thesis. An increase in buying pressure at the breakout level reinforces the conviction that a trend reversal is in play. If TON maintains its bullish structure, the next major resistance zones could be tested, offering traders and long-term holders a strong opportunity to capitalize on this technical shift.
With rising investor interest and a textbook bullish pattern breakout, TONUSDT is a crypto pair to watch closely. The breakout from the falling wedge combined with solid volume growth and increasing sentiment across crypto communities signals that a new uptrend could be underway.
✅ Show your support by hitting the like button and
✅ Leaving a comment below! (What is You opinion about this Coin)
Your feedback and engagement keep me inspired to share more insightful market analysis with you!

BTC Hits ATH Time But Dont Let Euphoria Ruin Your PerceptionBitcoin has pushed into new all-time highs and is now testing the same resistance zone we saw back in December–January. While the breakout is technically impressive, price is stalling at the exact level where strong sell pressure previously kicked in.
Today’s weekly close is a key confirmation point. But the bigger issue? Next week is stacked with macro volatility — PPI, FOMC, and other data drops that could rattle risk-on assets.
⚠️ What I’m Seeing:
- Weekly RSI divergence continues to build
- Volume is drying up, not confirming the move
- Macro pressure is incoming — timing matters
🧠 My Bias:
I wouldn’t be surprised by a final liquidity grab into the $120K–125K range — enough to trap late longs and generate downside liquidity.
Personally, I’m de-risking. Not shorting yet — just locking in some gains.
Ask yourself: Are those extra 10% upside gains worth the risk of giving back 30%-50%?
Not calling tops. Just following structure.
Always open to opposing views — discussion sharpens conviction.
Don’t let euphoria cloud your perception.
📉 Stay safe out there.

BTC shorts will get liquidatedHello everyone!
As we all witnessed, BINANCE:BTCUSDT experienced a sharp drop following Trump's announcement of new tariffs starting June 1st on all European Union . The big question now is: is this the end for Bitcoin, or just a temporary dip?
In my opinion, BTC is likely to move as follows:
It will retest the long wick on the 1-hour chart, which previously bounced from a 1-hour Fair Value Gap (FVG) , and then continue its upward movement.
Don't worry, everyone, BTC remains very strong!

BTC DOMINANCEBitcoin dominance could break down at this point, potentially signaling the start of an exceptional altseason.

Falling towards pullback support?Ethereum (ETH/USD) is falling towards the pivot which has been identified as a pullback support and could bounce to the 1st resistance which acts as a pullback resistance.
Pivot: 1,940.23
1st Support: 1,827.50
1st Resistance: 2,107.47
Risk Warning:
Trading Forex and CFDs carries a high level of risk to your capital and you should only trade with money you can afford to lose. Trading Forex and CFDs may not be suitable for all investors, so please ensure that you fully understand the risks involved and seek independent advice if necessary.
Disclaimer:
The above opinions given constitute general market commentary, and do not constitute the opinion or advice of IC Markets or any form of personal or investment advice.
Any opinions, news, research, analyses, prices, other information, or links to third-party sites contained on this website are provided on an "as-is" basis, are intended only to be informative, is not an advice nor a recommendation, nor research, or a record of our trading prices, or an offer of, or solicitation for a transaction in any financial instrument and thus should not be treated as such. The information provided does not involve any specific investment objectives, financial situation and needs of any specific person who may receive it. Please be aware, that past performance is not a reliable indicator of future performance and/or results. Past Performance or Forward-looking scenarios based upon the reasonable beliefs of the third-party provider are not a guarantee of future performance. Actual results may differ materially from those anticipated in forward-looking or past performance statements. IC Markets makes no representation or warranty and assumes no liability as to the accuracy or completeness of the information provided, nor any loss arising from any investment based on a recommendation, forecast or any information supplied by any third-party.

$PENGU Falling Wedge Bullish Daily CSECY:PENGU forming a falling wedge this will explote soon guaranteed I’m loading hard already! See you at the top!

Ascending Triangle pattern for Zcash or Hidden Bear Flag!!!??!?!It appears as though Zcash is forming an ascending triangle pattern, but often this can be confused with a bear flag depending on the Macro Trend of the asset.
The rsi is in a great place for the price to pump.
We have seen the price of Zcash touch the upward sloping support of the pattern over half a dozen times, this is the first time the price have dipped below the upward sloping support.
The price is going to need to rebound immediately if we're going to see a continuation of the pattern.

SOL ChartHey,
I've shared many similar zones now such as TOTAL3..
SOL is similar but looking sooo good for a large market cap.
Due to this clean demand area being respected...
And other projects looking similar...
New ATH's is what I see.
Long-term even 200B, but that is long-term.
New highs first, soon.
Kind regards,
Max Nieveld

Cardano against USDCardano may increase price against USD to $1.31 to $2.76 short term objective is $1.31 long term is $2.76

LINK ANALYSIS🚀#LINK Analysis : Pattern Formation
🔮As we can see in the chart of #LINK that there is a formation Head And Shoulder Pattern and it's a bearish pattern. If the candle closes belowthe neckline then we would see a little dump in #LINK otherwise it will go rise according to the market 📊
🔰Current Price: $21.80
⚡️What to do ?
👀Keep an eye on #LINK price action. We can trade according to the chart and make some profits⚡️⚡️
#LINK #Breakdown #Cryptocurrency #TechnicalAnalysis #DYOR

USDT Dominance Chart AnalysisReaction level: 4.60%
This area acts as a key overhead resistance, highlighted by price rejection at or near this previous level. A breakout above 4.60% would signal a change in momentum towards increasing USDT dominance.
Support area: 3.71%
This is a strong demand area where the price previously bounced. If the market returns to this level, it could provide crucial support and a potential reversal area.
The chart shows a clear descending channel with the price breaking or testing the upper boundary. This indicates a potential trend reversal or an attempt to move higher.
The price interacts with the moving average (possibly the 50-day MA), which has acted as resistance several times. Sustaining above the moving average would indicate bullish momentum.
DYOR, NFA
@Peter_CSAdmin

CRYPTO SUPER CYCLE 2024-2026:BEAR TO BULL ALL WHAT YOU NEED HERE🔄 CRYPTO MARKET CYCLES: MAJOR TRANSITION - FROM BEAR TO BULL 2024-2026
Technical Market Cycle Analysis:
- Current price: $346.31
- Clear transition from bear to bull market
- Three distinct cycles identified: BTC, ETH, ATLS
Market Phase Breakdown:
📉 Bear Market (2022-2024):
- Declining trend complete
- Bottom formation validated
- Accumulation phase ending
📈 Bull Market (2025-2026):
- BTC cycle initiating bull run
- ETH cycle following
- ATLS cycle completing the sequence
Key Observations:
- "Traders confusion" zones marked at critical transitions
- Clear cycle progression: BTC → ETH → ATLS
- Market structure showing higher lows forming
- Volume profile supporting bullish transition
⚠️ Critical Points:
- Major market cycle shift in progress
- Multiple timeframe alignment
- Clear cycle rotation pattern
- Historical pattern repetition
🔔 Market Intelligence:
- Bull market projected until end of 2026
- Three distinct crypto cycles identified
- Clear market phase transitions
- Institutional accumulation evident
#CryptoMarketCycles #BullMarket #TechnicalAnalysis #CryptoTrading #MarketPhases
Want detailed cycle breakdown? 📊FOLLOW ME

ETH thesis by Titan_KarmaEthereum Investment Thesis
Market Overview
Ethereum (ETH) is trading at $3,431.65, indicating potential for upward momentum. The recommendation is to OPEN LONG positions, supported by a favorable risk-reward setup and moderate confidence in a bullish trajectory.
Key Technical Indicators
Stop-loss: Set at $3,200.00, providing downside protection against unexpected price drops.
Take-profit: Targeted at $3,600.00, aligning with a strong resistance level and maximizing potential gains.
Exit Point: Positioned at $3,500.00, offering a prudent level for partial profit-taking.
Confidence Level
The confidence level for this strategy is 75%, reflecting cautious optimism. The technical and fundamental indicators support an upward trend, though volatility requires close monitoring.
Correlation with BTC
Ethereum shows a neutral correlation with Bitcoin (0.02), suggesting its price movement is minimally influenced by BTC. This allows ETH to follow its own market dynamics.
Position Analysis
Open Long Positions: None currently, presenting an opportunity to take advantage of the recommended strategy.
Open Short Positions: None, indicating a lack of bearish sentiment.
Risk Management Strategy
Entry at the current price of $3,431.65 is ideal to capitalize on potential gains.
A well-placed stop-loss at $3,200.00 minimizes risk in case of downside volatility.
The take-profit level at $3,600.00 provides an attractive target, while the exit point at $3,500.00 ensures partial profit-taking to secure gains.
Recommendation
OPEN LONG positions near the current price, aiming for a take-profit level of $3,600.00. The combination of technical support and moderate confidence in the bullish scenario supports this strategy. Traders should remain vigilant for any changes in sentiment or technical indicators that might influence price movements.

JASMY/USDT Price Analysis: Potential Cup and Handle BreakoutKey Highlights:
Cup and Handle Formation:
The pink curve represents the "cup" part of the pattern, showing a rounded bottom structure. This formation is typically considered a strong signal for a continuation of an upward trend.
Fibonacci Levels:
The red, green, and white horizontal lines represent significant support and resistance levels. These lines resemble Fibonacci retracement levels and indicate where the price might encounter resistance or find support.
Flag/Channel Pattern:
The blue highlighted narrow channel illustrates a consolidation phase, suggesting preparation for a breakout to the upside.
Target Levels:
The blue arrow on the chart indicates an expectation for the price to rise to the 0.09026 level first and potentially continue to the 0.36202 level in a strong bullish move.
The price is currently trading at 0.05321 and seems to have broken through a previous resistance level.
If the price manages to overcome the resistance levels at 0.04258 and 0.09026, this could signal the continuation of the bullish trend.
However, if the price loses the support levels at 0.02585 or 0.01726, there is a risk of entering a bearish trend.
From a trading strategy perspective, it may be worth considering positions above resistance levels or entries near support levels while managing risk effectively.

INJ Long Spot Trade (Support Pullback)Market Context: Since Monday, INJ has shown a strong reversal. A minor pullback to the $18.00 support level could offer a favorable entry for a long position if momentum sustains.
Trade Setup:
Entry: Around $18.00
Take Profit:
First target: $20.50 - $24.00
Second target: $28.00 - $31.00
Stop Loss: Just below $17.00 (daily close)
This trade targets further upward movement while maintaining a manageable risk. #INJ #Crypto

AR Long Spot Trade (Low Volatility Expansion)Market Context: AR is holding above a critical level with low volatility, suggesting a potential expansion soon. This offers a good entry opportunity.
Trade Setup:
Entry: Around $18
Take Profit:
First target: $24
Second target: $30
Stop Loss: Below $16.5
This trade is positioned for potential breakout and expansion. #AR #Crypto #Trading #Volatility

$BTC preparing up for Mega Run!#Bitcoin is in the preliminary stage of a parabolic run like in 2012, 2016 and 2020!

hoping for another bounce?I think we have been ranging that bottom end a while now, we could see a bounce up to the top of the range, then depending on what's happening when we get there, further up, or a bounce back down (my inclination in down)

LINK Long Position (Major Support Level)Market Context: Many altcoins, including LINK, have retraced to critical levels of support, presenting an opportunity for a long trade. LINK is positioned well for a potential bounce, providing a favorable risk-to-reward ratio.
Trade Setup:
Entry: Between $10.00 - $10.90.
Take Profit:
First target: $12.50 - $13.30
Second target: $14.50 - $15.50
Stop Loss: Just below $9.40.
This setup leverages the strong support zone and potential for a bullish recovery. #LINK #Altcoins #Crypto

FET Long Position (Bull Market Anticipation)Market Context: FET is demonstrating a shift in market structure, indicating the potential for an upward trend. As a strong AI-related asset, it is poised for the next leg up in the current bull market. We expect one final shakeout below the previous fake low, providing an optimal entry point for a long-term position.
Trade Setup:
Entry: Around $1.15.
Take Profit:
First target: $1.70
Second target: $2.00
Third target: $3.20
Stop Loss: Daily close below $0.95.
This setup allows us to capitalize on potential upward momentum while maintaining a manageable risk. #FET #Crypto #AI
