Crytpocurrency

RIF/BTC { RSK INFRASTRUCTURE FRAMEWORK } - BULLISH SETUPANALYSIS 🔎
- RIF/BTC is printing an ascending triangle pattern.
- This is a bullish build up pattern.
- There's a breakout potential.
BUY ENTRY ⬆️
- Market entry: current market price.
- Stop limit entry: breakout above the ascending triangle's horizontal resistance (@0.00000521)
- Limit entry: test of the ascending triangle's inclined support.
TARGETS 🎯
- Fibonacci extension levels.
SETUP INVALIDATION ❌
- Breakdown below the ascending triangle's inclined support.

BTC Short Short Squeeze into the May CME Gap - 14 August 2021Lots of interesting stuff
the swing fail didn't play out and instead got short squeezed
this leg up took us right into the old CME gap from May
what this means is that anything we do in here will probably cause a quick move to fill by monday
the last few stops are just above us from 49.8 to 51.5 after that it's a straight shot
to the April/May Monthly Open
Whatever we do in here what matters is the market open.
Still long from 38 and looking for the high timeframe move to see BTC go up and
swing fail the May/April monthly opens.

MATIC/USDT Enter Long 📈Was on my watchlist for more than a week and I wanted to see the EMA200 hold.
EMA50/34 pushing well and we're on a good demand zone.
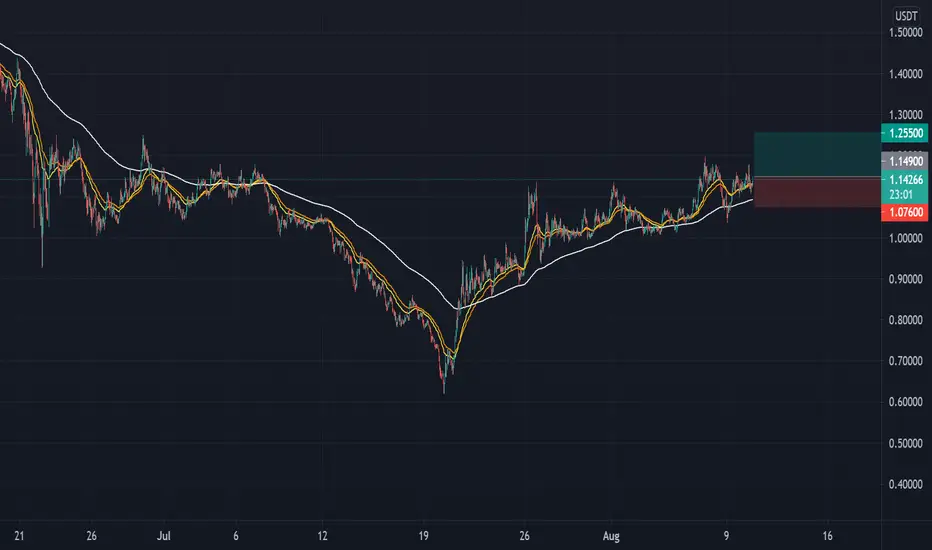
ADA/GBP 4HCardano (ADA) / Great British Pound (GBP)
4H time frame
As you can see Cardano is going in a bullish direction. I believe there will be a tiny resistance that will lead to a short downtrend towards the 1.1000 mark before turning around back into its bullish direction towards 1.3000 - 1.3500.
If you have any questions, tips or opinions about my analysis please feel free to comment below or send me a direct message.
THIS IS NOT FINANCIAL ADVICE
Thanks guys
The Crypto Planet

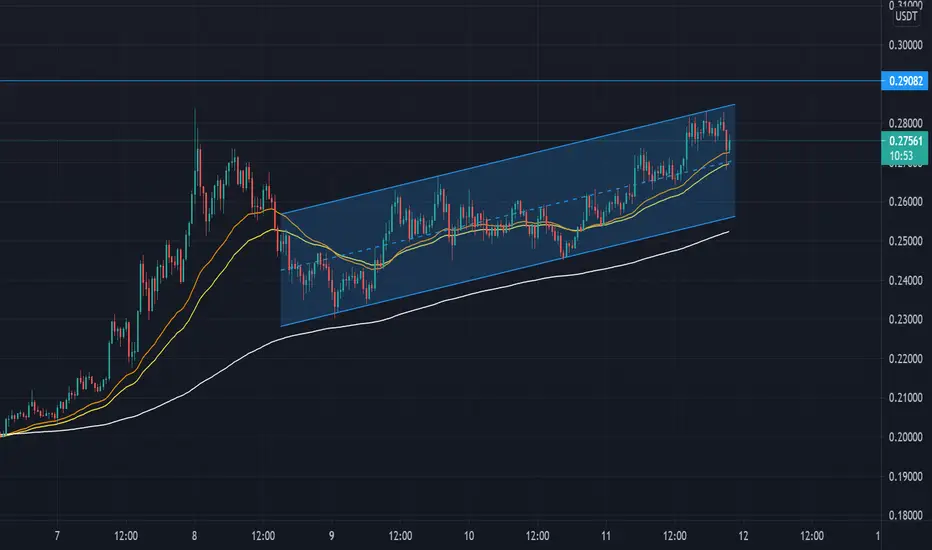
XTZ/USDT Enter Long 📈Took an exotic time frame here, and just found out that XTZ reacts well to the EMA200 on the 8hr chart.
We're consolidating just above it like we used to see on the 4hr chart before, EMA's crossing and curling up.

BTCUSD Correct and continuation!!! Market is ready to take off but it needs to give a last shot. News are allready trying to manipulate the market.

TOMOUSDT - UPDATE
TOMO is in a strong uptrend on the daily timeframe and has recently provided us with a nice deep correction to form another new higher low. On the 1hr timeframe we can see during the correction the price has formed a falling wedge (bullish pattern) into a strong area of demand, this is a great area to load up on this coin.

BITCOIN - Volume profile analysisIt needs to sustain above 42500 for a fresh breakout.
The next target 47000 can be attained.


Chainlink Link/usdt shortCrypto market has been rising for 11/12 days without taking a break,so it is likely a small pullback before rising again.The price got rejected by EMA200, RSI is almost at oversold area and the price is at the top of the bollinger bands.It is possible to set a short position with a entry near the top of the wicks of the last 3 daily candles and a stop loss above EMA200 that is acting as a resistance.

BTC testing the resistanceOn the 2 hr chart we're in a wedge pattern showing signs of a strong uptrend over the last 6 hrs, now we'll need to see if we can continue this trend through the top of the wedge.
Or if were going to lose momentum & get a Pullback to the lower resistance, I do believe we will see 1 more large pullback before we get on a nice bull run.


DOGE - Buy the FEARLooking more and more like a bottom forming on DOGE and my take is it will back-retest the low $0.16xx once more before actually reversing to the upside.
Note: Selling volume is/has dried up. RSI and other indicators pointing up on the daily. High volume support exist here from the mid April run-up on DOGE.
Waiting for confirmation/retest.
Not finacial advice.


ChainLink possible scenario Come True =D 15/7/21
Congratulation for the player who follow the strategy,
Short trade Mission complete.
Please comment below if you are the one follow the strategy =D
Thank you

Ascending Triangle breakout to the upside for BTC??!!??On the RSI Bitcoin appears as though it wants to break the downward sloping resistance of a descending triangle.
The upward sloping support of the ascending triangle has seen multiple touchpoints, and the more a trend line is tested the more likely it's going to be broken, the same goes for the horizontal resistance.
The KST is displaying a bullish cross where I have placed the green downward-pointing finger. If you zoom in closely it'll be more noticeable, and it's coinciding with breaching the downward sloping resistance of a similar pattern on the RSI.
It's always possible we see a bearish scenario, I will link a recent post displaying a more macro bearish perspective, but on a micro-level, there's definitely some bullish potential.

A CONFUSED MARKETYeah. this is what happening when the market is uncertain of its direction. TAYOR. Bullish BAt still valid amid of pending completion of bearish Cypher pattern.. confused? so am i.

Wink bull This sideways chop shall end sooner than later accumulation happens in many ways. The bear is truly exhausted. The next run will be much greater then the last, dont miss out

BTCUSD : Still Long / Bullish ?So... on BTC, my bullish setup is as follows:
EW wave 1 with 5 waves has completed then after we seen an ABC correction that we forecast has ended @68.1 so long as it does not break below 68.1 if it does then we are forecasting that our wave 2 then will be @78.6 where then we will be looking for another different buy setup if there is.
but for the current setup we then currently see the market @78.6 of the lower degree waves where we are forecasting that we'll have our 1 & 2,3,4 till 5 of Wave 3 of the Higher degree.
Please remember market structures change so Trade Responsibly and Don't forget to use your own Risk management.
Also this is my bullish forecasting as i also have Bearish forecasts as well incase bulls fail, so i will be updating you gyus, dont forget to like,follow and share. Dankie

Dogecoin MIXED MovementWe find ourselves in a current consolidation area between the previous two consolidation zones. All of my indicators are squeezing while the price stays at a standstill, we are prompt for a big move soon. -THE TRADERS TRIBE.
