Icon looking Bullish. Watch MACD crossoverFor over a month now, ICXBTC is trading above the Ichimoku cloud. Beginning of the month it perfectly bounced back of the support of the cloud which is a bullish signal.
Now we are also seeing a MACD crossover incoming. When the MACD crossover is realised, I will be very bullish on Icon.
Another bullish signal is a rise above the Kijun Sen (blue line).
My targets will be:
1st: 0,00005526
2nd: 0,00006825
Crytpocurrency

iExec breaking out. Big pump possible Currently RLCBTC is gaining a lot of momentum.
SMA 100
RLCBTC has tested the 100 SMA quite extensively over the last month. After it broke out downward of the Ichimoku cloud beginning of september we were negative on the performance of iExec. But the SMA 100 was succesfully tested.
Potential MACD crossover coming up
A bullish crossover occurs when the MACD turns up and crosses above the signal line. The Blue Line is now at equilibium and when it crosses the orange line iExec will gain a lot of momentum.
The Kijun Sen
The Kijun Sen (blue line) gives a bullish signal since it is now trading above it.
All and all the signals are looking good but RLCBTC first has to conquer the bottom of the Ichimoku cloud before it can go to its old highs.

Long QTUMXBTOscillator crossing oversold levels back into the bullish control zone, RSI EMA has a nice upward slope. Price action bounced nicely off of the 200 EMA, SSL has flipped Green, and VWAP has just crossed back about the mid line while money flow is in the positive. Looking for another small move, but mostly testing out a new strategy. Lets go!

$SPX under $3350 zone ~ bearish for $BTC (bitcoin)below $3350 and looking bearish ~ imo
$BTC will fall with $SPX


$LINK / $USD - (the road back to $20)Good morning (please hit that like button if you like the visuals and perspective i'd painted in this TA)
My visuals for $LINK / $USD.
Post an update on this chart tomorrow or the next day with progress.

Bitcoin entry in Re-accumulation's cycle marketIn the long-term, Bitcoin show a interesting cycle of re-accumulation to continue bought throught the 2020, and also we could to formed a consolidation between the $10,191 USD and $12,000 USD, that is a data that I could to show you and believe it.
But remember that technical analysis in micro-trend we could to experiment and know what Bitcoin do in short-term while the candlestick's studies and supply and demand zones.
Also guys, I invited you to look out my old technical analysis of the future of Bitcoin, it's so interesting to know the model that I prepared for you!!! And the Gold.

Bitcoin close to 10000,00Firstly, please support our work by clicking like button & or following! These really assist us to reach more investors & traders like you! Bitcoin slides below 10K. At current levels technicals are on the side of bears.

Ethereum is continue bullish: Updates!!!
Maybe as learing, that could be to put a buy order limit at $418 USD, that is the strategy but as I entry so up in the $425 USD, Ethereum take my SL and then, while I sleeping in the 3 am in the US Eastern Time, in the New York session, this hour I am sleeping, but I re-entry and recover all my net loss.
But, the proyection is that Ethereum is goes to the $$440 USD and I'm in long.

Bitcoin lead to EthereumHello, in this analysis, Ethereum show a bearish signal, we have the same situation of what Bitcoin do. I see a bearish BAT, also, more interesting to make it. Ethereum is into this descedent triangle in formation
It's seem a possible reversal of the trend and then, we could see an Ethereum on the $338 USD in short-term.
So, I put another short position in this cryptocurrency.
I'm in short in Ethereum and Bitcoin, because we could see a drop, more important is to watch about more Bitcoin price action

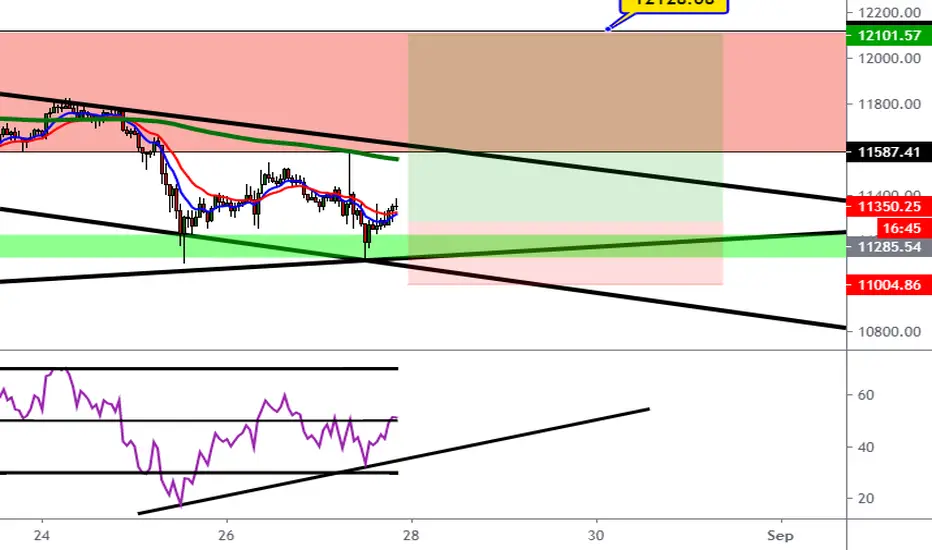
Updates: Bitcoin show a momentum change of sentiment: Bullish!!!Hello, in this updated we see that Bitcoin show a support at the levels of $11,100 above, that mena that boughters are here defend the zone to make a Bitcoin continue in this trend. Also, as updated in my technical analsyis, I identify a formation of ascendent triangle in H4 timeframe, that in the pass was a bearish rising wedge, now a bullish channel, also, there will be a possible formation of bullish divergence so positively and double top, that is a bullish signal to buy and then, closed up shorts position to put long order above of $11,300 USD, I put my buy order limit at $11,320 USD.
As we are in this little descendent channel, the expectative is so bullish of then
Also, there are a good signal in the Hourly timeframe, that is H4 and H1 timeframe show us a bullish divergence so perfectly!!!
Well, in conclusion I believe that Bitcoin want to make a up of $12,000 USD, and then, we need to look out if Bitcoin could to pass above of $!2,000 USD, that is a indication of bull signals.
I zoom out, buf if you want, you can to zoom up to see so nearly in your eyes, I put it to watch so better for you!!!
So, the short position I will closed up manually!!!
Elliott Wave VIDEO: Is Bitcoin Ready For A Deeper PullbackGood morning traders,
We have seen some reversal down from the high in the last few days, so I am wondering if BTCUSD is maybe headed down for a deeper pullback.
Hope you will enjoy the video. And please press like and leave us a comment below to support our work.
Trade well,
Grega


BTCUSD Trade SetupThis Analysis Is Done Only For Educational & Intelligence Purpose, Invest Or Trade At your Own Risk & Will.


Bitcoin: Tripple Top: Bearish Movement!!!Hello, the latest analysis was cancelled to take other confirmations, for now, we see that bears want to sell Bitcoin, guys, that is another point to take noticed it, tripple top it's mean a change of trend, in tat case is for micro-trend. So, we see a tripple top in H1 timeframe with a possible entry in short in the $!1,870 USD, its confirmed. So, beware to put longs position in Bitcoin
The trend could be influence in Daily that we are overbought and bears want to sell Bitcoin at below of $!2,000 USD as key resistance in weekly

Ethereum Short Setup - BEARISH!Ethereum is fighting to stary above the channel resistance and is now forming a tight and steep downward sloping triangle. If Ethereum stays in this pattern then I expect ETH to test $400 or even as low as $293.

DXY Falling out of Broadening Structure (Bullish for Crypto)From the period of 2017 to 2018 you could see a large drop in DXY (which occur ed the same time as the crypto bull run of 2017). This caused the crypto market to increase in market cap by hundreds of percent. We are once again in one of those situations today (see the obvious broadening structure that DXY has recently fallen out of. It is my believe that as long as the dollar continues on a downward trajectory this should serve as a bullish indication for dollar denominated assets. Watch for a bounce towards the end of the year 2020 (we should get a significant bounce in the dollar at some point; which would cause money to leave the crypto market in that scenario.
THIS IS NOT FINANCIAL ADVISE, ASSUME YOUR OWN RISK; Y'ALL ARE ADULTS.

ETHBTC Still Testing Top Of Significant Channel Trading is a game of risk management.... and lots of patience.
The low time-frames are compelling because we have the instant gratification (or despair) of seeing our positions win or lose.
Higher time-frames visible change much more slowly. Days ago we alerted you to ETHBTC reaching near the top of a trading channel (as shown in pink). The picture still looks the same. The price structure does not suggest a decision in the market yet. Up or down. Fast or slow. So we wait... patiently, observing, checking different indicators, considering scenarios.. and yes, checking lower time-frames for clues of momentum.
The scenario remains... a drop of 14% from current price ratio down to the significant horizontal (shown white) to re-load Ethereum for a continued bull run against Bitcoin in the coming weeks.
Why are Ethereum and Bitcoin significant, even when altcoins show higher price volatility? Because the rest of the market is very much influenced by the big Gorilla's in the room.
If only there was a platform to help navigation the volatility with proven fully backtested signals?
:)
Note: SparksterSignals (including our technical analysis and our algorithmic backtested signals) are not provided as financial advice.

Bitcoin to emerge from the fallBitcoin is forming triangle in hourly chart with 11400 as the base resistance.A definite close above 11420 will take BTC to 11650. Both RSI and Stochastics are emerging from the over sold condition and is a bullish for BTC. Traders need to wait for close above 11420 to go long aggressively.

XRP IS GAINING BULLISH MOMENTUM!!I spotted Double Bottom pattern on XRPs 30min Time-frame. Following the recent breakout of Weekly resistance, XRP continues to show bullish signals towards new highs. If increase happens i'm expecting price to rise to 61% Fibonacci level. I would like to gauge your opinion. Post your analysis below!.

XRP IS HEADING BACK UP!!I see a possible Inverted Head & Shoulders pattern forming. Price would have to move upwards to 32 cents zone in order for a Bullish confirmation to be completed. Expecting bullish movements to profit level indicated on the chart. Do you predict Bullish or Bearish action? POST YOUR COMMENTS BELOW
