Bitcoin: Next up trend startedAfter yesterday 1000+ fall, Bitcoin is looking to regain its momentum. On hourly charts it shows the sign of revival and may continue to slowly rise.
Crytpocurrency

DASH / BTC - an expected breakthrough but to where?I've been monitoring Dash the past weeks and I see a huge potential, especially as it seems a bit left off from the rest of the alt rally that we have been witnessing.
The diagram shows a very weird progression since the last impulse and I've been pondering where the fuck to place the abc correction so there are 2 possibilities in the short term:
1. Either we have set the C wave and we should expect an upwards impulse or
2. We are in the C wave now and after it finishes above the start of A wave, we would have a down impulse to set the bigger C wave from where we should shoot up.
So either way, I had entered previously at about 75k btc and will ride to the circled zone from where we should scrutinize the price action and determine whether we continue up or go down to complete C wave.
External factors:
BTC/ SPX correlation seems to have cooled off and BTC is a big boy again doing its own thing but still - I am short Nasdaq for a while which means that the overall market may tank, if it takes BTC with it, confidence in alts could go away and we will go in the red. So keep it a quick trade with a bit more looking after the position.

BTCUSD showing a bit of a strengthNot a clear cut trading opportunity but Bitcoin can potential rise to highs of $11,500 to make the 5th wave. Wouldn't trade it though but a good indicator for trading ALT Coins

BTC (Y20.P3.E21).Macro.Why I am still bullishHi All,
As time passes, we get more clues to the probability of the price action.
Here I have summarized the main reasons apart from previous posts due to new perspectives from a number of sources.
a) Elliot wave theory 1 -5 (as per main chart of this post)
b) SP500 recent price action \ correlation
c) BTC historical evidence
========================================================================================================
a) Elliot wave theory 1 -5
========================================================================================================
Observations:
BTC price action correlates well with the Elliot wave theory for the impulse wave between 3 to 4 as a complex correction wave which is a shakeup of week hands, as shown above.
There is an another probable complex correction wave for 3 to 4, which has a dip followed by a strong rally\bounce to point 5 (this could equate to 8500 range)
Note: Weekly Phoeix RSI is poised for a leg up with bullish energy rising while price action was sideways (ref X.Charts)
========================================================================================================
b) SP500 correlation
========================================================================================================
In past posts I have extensively covered the correlation between the two with their pivot points or key levels with BTC price action, so I'm not going to go over that.
However recent price action on the SP500 gives us clues to the bullish nature and hence BTC correlation, it seems perfect timing.
Here, let me explain.
Note this chart of the Sp500, how price action was rejected x3 times at the weekly resistance level.
Now look at the 2nd chart where SP500 future contract (CMF) chart and the gap, which was filled last week.
When price drops to cover a gap, its seen as a bullish move. Combine these with the current level, we also see a bullish pattern
========================================================================================================
c) BTC macro TA (ref A.Charts)
========================================================================================================
Observations:
** Monthly candles with large sell off (as per chart below), then finding the bottom, and when we have a event with a large monthly rally, the next bull market\phase starts.
** Lead in trend line with the additional HALVING and followed by low volatility
** Price action above the Weekly 21 EMA and\or Monthly 10/21 EMA
Note the 10/21 EMA ribbon and how price stays above it, in conjunction with the other information, it gives amble weight to a bullish perspective
========================================================================================================
BTC support and resistance levels based on monthly charts
Previous post
Please give me a tick or like for this post.
Regards,
S.Sari

VET WEEKLY VISUALall trading patterns and indicators aside
VET is most probably heading for .032
after that there is a likely chance for some additional multiples
even if VET reaches .50 I would still have positions left to trade out of
anyone have a higher target for VET with some TA or FA to back it up?

VET.BTC (Y20.P3.E1).Its about timingHi All,
I see another small trade opportunity. Inverse H&S or triangle breakout.
Cheers,
S.Sari
Daily looks good
Weekly, still bullish but aware of the RSI (87%) in over extended region

Bitcoin Volume Drop Inner Trend Line Form, 3 TouchSignificant drop in Volume in the last 24 hours from 17 Bill to a measly 13.7. Coinciding with this is the third print for a trend line to form within the price structure of price region spoken of in last few write ups. >
Note that some traders will draw from the wicks (I hold more significance here as that's where price has printed):
With others using the bodies fro more solid ground:
If price continues to drop the values of resistance will change over time, so be aware of both.
As per yesterday the same remains the same. However as broken the swing high, now price needs to find strength to break the swing at 9800 which is going to be a mean feat considering current volume and dynamics at play.
Resistance from above remains the same, see below link to that more expansive write up.
Happy Trading :)
Bitcoin to Date
Daily
Current Price: $9256.0 USD
Daily Change %: -0.67%
Market Cap: $170,764,298,068.75 USD
24 Hour Volume: $13,762,327,897 USD
Population of the World: ~7,796,526,622+ humans
Today’s Bitcoin Total / World Population: ~ 0.002363287837329 Satoshi’s / $21.57 USD per person
Overall
Approximate Bitcoin in Circulation: 18,426,344 BTC
Approximate Bitcoin Mined Last 24hr: ~ 900 BTC
Approximate Bitcoin Left to Mine: 2,573,656 BTC
Road to 21,000,000 Bitcoin Mined: 87.74%
Current Bitcoin Dominance: 64.65%
📈Support & Resistance📉*
Support Levels
1st Support Zone: 8963.6
2nd Support Zone: 8666.7
3rd Support Zone: 7840.4
Resistance Levels:
1st Resistance Zone: 9889.2
2nd Resistance Zone: 10285.8
3rd Resistance Zone: 10781.2
Price Level Consideration
Approximate Days Until Halving: 1401 Days (Pending Timezone / Blocks Mined)
All Time High Half Way Point: 9942.5
Prominent High: 13767.4
Prominent Low: 3994.1
🐃 Bulls Verse Bears 🐻
🐃 Bullish Above: 10485.8
🐻 Bearish Below: 6474.1
Monthly & Weekly Opens
Monthly Open: 9171.5
Weekly Open: 9084.0
Current Price Zone: ACCUMULATION ZONE
Biggest Bitcoin Transaction of the Day**
1. 🚨3,500 BTC ($32,382,992 USD) transferred from Unknown wallet ➡️ Xapo 🚨
2. 🚨2,300 BTC ($21,425,900 USD) transferred from Binance ➡️ Unknown wallet 🚨
3. 🚨2,000 BTC ($18,613,810 USD) transferred from Coinbase ➡️ Unknown wallet 🚨
Largest Cryptocurrency Transaction Today:
🚨 🚨3,500 BTC ($32,382,992 USD) transferred from Unknown wallet ➡️ Xapo 🚨 🚨
Gold***: $1,794.62 USD -0.01 -0.00%
Silver***: $18.28 USD +0.01 +0.04%
——————————————————————————————————
*📈Support & Resistance📉: These are typically zones & not exact price levels depicted by the lines. Keep in mind that price may respect and repeatedly touch several times on smaller time frames.
**What you won’t see on exchanges: This is purely to reference that traders watching the charts are neglecting the ‘Transaction Sentiment’ of large (🐳 WHALE) transactions from wallet to wallet and OTC execution send transactions (new/old wallets). TIP: The amount/s transferred daily tells a story of flow to potential market dynamics that may transpire.
*** Personally I HODL Gold/Crypto over having a majority of Fiat currency 💸. Previously before trading crypto in 2015, Gold was one of my main charts thus I look at the price regularly comparative to Bitcoin.
Created & published by Des Landen
Landen International
Trading Playlist: Sail - Awolnation

Bitcoin, return of volatility ?Hello avid investors and traders out there, I will make a little study market of Bitcoin.
Bitcoin is in weekly consolidation for the 9th consecutive week and last week's candle closed in doji for the third time in a row.
Suffice to say that nothing has been going on for 1 month and a half because the price is still in the range without giving any indication on the continuation with a 50/50 chance of breaking up or down.
The price is drawing a “pennant” triangle. The Pennant is a chartist figure of consolidation, very generally if it comes from an upward movement, it is statistically more likely to break on the upside.
On the other hand I always distrust this figure which very often gives false signals either by breaking first by the top, by drawing what is called a fakeout (break out which fails), or by breaking by the bottom of first and then cross the upward triangle.
Lately the traditional markets have not decided either. With each bullish momentum, there is a bearish momentum and the gaps to be filled move. The whole reacts significantly to each economic news whether "positive" or "negative".
Until the traditional markets decide to resume the uptrend or start a real correction, there is little chance that the Bitcoin market will come out of this consolidation. Furthermore, the correlation between Bitcoin and risky assets like # Sp500 is extreme ...
I recalculated the Expected Move option contracts on July 31 to see the volatility this month, according to traders and option investors. The EM calculation predicts a movement of 930 points which still leaves us in the range.
I remind you that the ME is a statistical analysis which makes it possible to obtain a cone of probability. There is a 68.2% chance that the price will close in the cone until the end of the contracts. According to the ME, there is still very little volatility to predict.
Traditional markets are likely to be quiet this summer like everyone else, so implicitly, there is a good chance that the Btc will be too.
At the start of the evening yesterday, Bitcoin tried to cross the $ 8,900 to encourage a large number of sellers to shorten. The bearish movement did not last long because yesterday's day ended with a huge daily hammer.
As a result of this movement many shorts were trapped in what is called a "Bear trap". Many shorts were trapped, resulting in many liquidations which allowed the rapid uptrend this morning.
In Daily time units the price of Bitcoin has trough above the previous one, the first signal of a possible trend reversal.
I remind you that last week Bitcoin went into a daily downtrend.
To have a structured short-term plan, I usually frame the last peak and last trough in what I call a decision rectangle. A bullish crossing would lead me to seek purchases while a bearish crossing would certainly lead me to seek sales.
If the last low of 8920 is maintained and the last peak of $ 9,300 is crossed upward, it is likely that the price will go to seek the $ 9,800, significant resistance.
On the other hand, if the trough is crossed downward, there is a good chance of first looking for the weekly resistance of $ 8,600. If this weekly support is crossed, the rebound zones likely to serve as supports remain the same as last week.
As long as the $ 6,000 level is maintained, Bitcoin still has chances to maintain its bullish bias and try to cross the $ 10,500 again. On the other hand, I doubt that the crossing of this resistance 10 500 will take place before the summer.
Follow closely the news of traditional markets and the trend of the SP500 because in the short term it is he who will dictate the conduct of Bitcoin

??????
OMG!!! CLOSING ALMOST CLOSING IN THE 1H, 2H, 4H, 1DAY, 1 MONTH, 2 MONTHS, 3 MONTHS, 6 MONTHS CHART!!!

BTCUSD - Buy trade displayed.Great sell trade now we show a buy.
Lets see how it plays out.
Regards
Darren

Bitcoin trading from 9K to 10K another great timeThe Upper line is the major down trend from the highest point from 19K back to 10K
Buy now!

ONT.BTC (Y20.P3.E1).More to goHi All,
Looking at the recent pullback, and acknowledging that the drop or rise in BTC with these impulses has given us many mini Alt seasons.
So lets make the most of it.
Based on my lines and a breakout from the wedge and a pullback to the 0.5 fib level, can possible allow the flagpole target to be reality.
We still have a nice uptrend formation, one of the better structures for the Alts.
As per the chart, my 1st target is 0.000074 - 0.000075
2nd target, for the inverse H&S, chart below
The only issue I have with this setup is the 2 wicks on the 12 HRLY as it makes the stop limit loss more than I like.
Please give me a like or tick for this post.
Regards,
S.Sari
12 HRLY chart - displaying major levels
As the friend said, a inverse H&S as well as the main target

13% Binance Coin Dip Incoming?Current momentum on the 3-day time-frame along with the Double Top formation suggests BNB may be in for a 13% correction, unless the bitcoin jumps to life anytime soon and continues to carry the broader market up with it.

ZILUSDT continuing the trend - 0.25$ in sight Hey everyone,
looks primed for further upside. Let's see if it gets that volume spike.
Take care,
Vlad The Crypto Trader


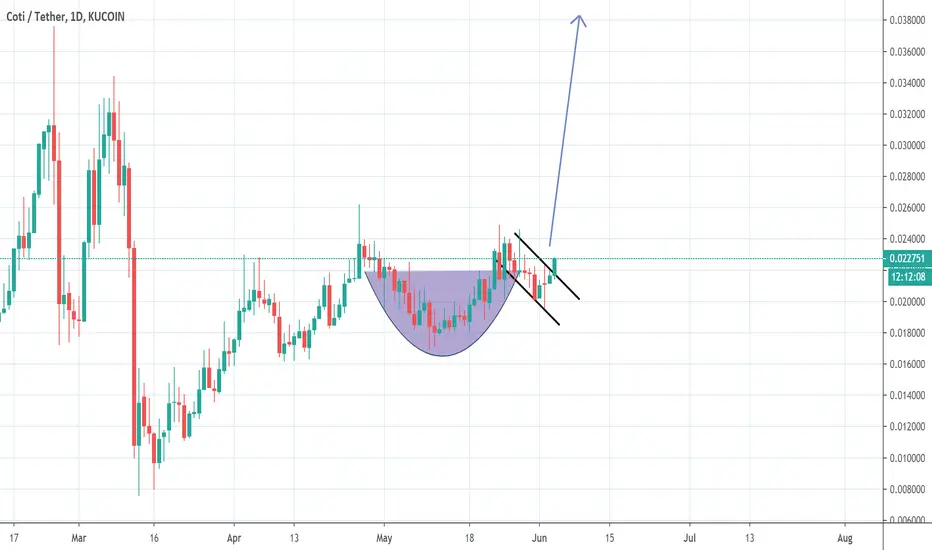
COTI/USDTPerfect Cup and Handle formed.
Coti is about to explode.
Paypal of crypto. Can process 100,000 TPS.
Alot of projects and companies are going to want to implement COTI like Cardano did with ADA pay.
Ethereum/TEtherUS Elliote Wave setup BinanceHello, Guys
Now Ethereum has Riding on impulse wave 5 and has Expected to shift on corrective of ABC wave.
When you extend Third-wave that did travel more than 161.8% at 230 of Wave-1 is considered as an Extending Wave.
@ 4 Wave completed at 200
Now if you can Like to entry in ethereum according to wave principle you can average your Shorting position until 250 -260 or shorting between this area.
Use minimum leverage for creating your average shorting position!
Thanks

ETHUSD Short breakout below 50 SMAExpect ETHUSD to breakout below the 50 SMA to around 225. That is around a 50 percent pull back from the big move up this weekend. Another long buy is probably in order following.

BTC (Y20.P3.E9).Macro.Formation.v2Hi All,
This post is a continuation from my previous version 1 post which for now looks like it was spot on. Refer to the bottom of this post for the chart.
> Hence it gives me somewhat more confidence to use this methodology for the next round of the cycle since we have the latest price action and what I presume was the top
(as we have broken the uptrend with no new higher highs)
> This methodology refers to the Inverted BARR approach. Using this to identify 2 potential targets and applying it to the macro structure, it seems there is confluence with the ABCDE elliot triangle correction wave.
( For a TA explanation of this chart, in terms of lead in trend lines and how they are used to deduce the target, then please refer to the post below and a video post to support it)
Summary (What to take from these charts)
=======================================================================================
> Note: Diamond top pattern, reversal pattern
> We have the 10/20 EMA converging around the 8150 range on the Weekly
> We have the 100 EMA 7400 range which played a significant role in the past in terms of support
> With the Inverted BARR we have the bottom around 6700 and 7000.
> Using the volume profile approach, we have 6700 as an area with strong support, so just above it, is 6900. This also has confluence with the 0.5 fib retracement.
(refer to chart below)
> Looking at the chart, the range from 7500 to 7800 looks like a strong support area which has confluence with this strategy.
> So these 2 areas are of interest to me in terms of going in long\strong. That is 6700 and 7500, more so, 6700 to 7000 if I was to choose.
> I expect a nice bounce when we hit the 0.236 fib level (double bottom) around 8350 -8500 and 7850 to 8050.
> I expect a strong rally at the 0.382 fib level 7450
We plan and the market makers plan, so we just have to take each level as it comes.
WEEKLY Chart with 20/50 EMA ribbon and the 100 EMA.
One can see in an uptrend, the weekly 10/20 ema played a significant role and the 100 as the
V1, Previous post

#Bitcoin AlternativesBitcoin Alternatives
Decision area (Red area)
1) Blue path (WXY)
2) Pink road (ABCDE)
3) Yellow road (WXY)

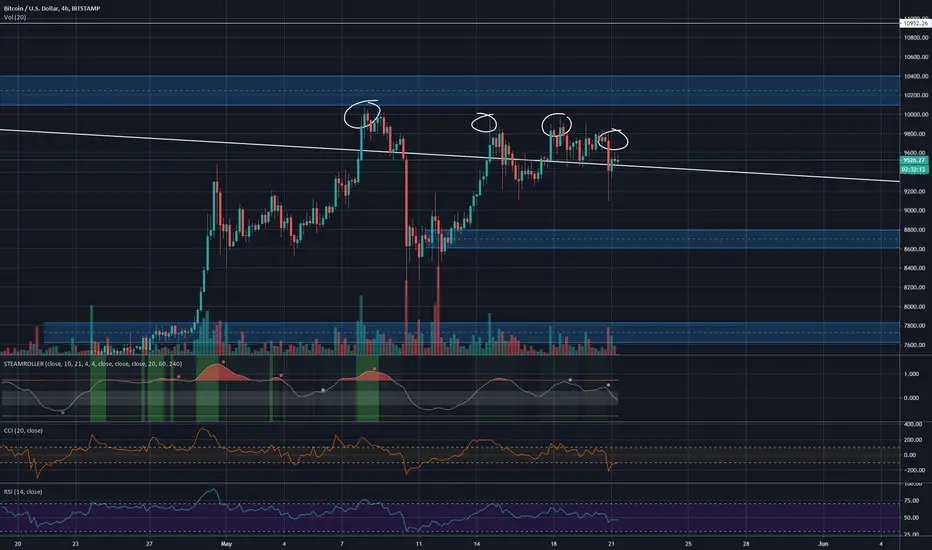
BTCUSD - Is this the final straw??Good morning @everyone
We had a decent volume injection overnight, pushing us down, giving us a near 700$ swing. This is a good sign, depending on what side of the trade you're on.
Since reaching 10k, we printed nothing but LHs, the move last night was no exception, while we have been toying with the idea of this trendline, I'm not sure how much give it has left.
I'm still very much aiming for that 8800 area, the overall market structure (highlighted in while, especially on the 4h) supports this.
On the 1D however, we are slowing moving sideways, which is cooling off a lot of our indicators, most of which are moving right and showing no clear direction.
AIO Down - 8800
AIO Up - 10000 - 10100
ETH Has Room To RunETH is a buy right here. The roll-out of ETH 2.0 provides a catalyst to fuel the rally.

ChainLink Eyes 23% Rise To Re-Test HighsThe current outlook for LINK is positive, with 3-day chart showing MACD turning up, cloud future positive, and short-term MA's teasing price appreciation. Target sits at $4.80 (24% gain).
