Bnb , wait a bigger correction!Guys Bnb is overstretched, don't buy it before all this up starting to make a nice retracement at .382 at least. Be smart and wait for the pullback!
Crytpocurrency


XRP, the move is not clear short term!Guys be careful because xrp is not in the perfect spot. Can make a bullish consolidation up but also can retest the lows to .37 cents. A better way is to buy a small position and not risk all in one trade.

Loss of Momentum and double top, a reversal is comingBTCUSD Has slown down after hitting resistance twice, and volume is dropping fast too.
The MACD death cross would seem to indicate the uptrend is over and a reversal is about to happen.
The loss of momentum also would indicate that.
I expect BTCUSD to drop below the previous support line and hit the Senkou Span B, a breakout is posible if bearish sentiment continues.
Bearish news could make matters worse, like the possible restriction of Binance for US Customers one of the most important Crypto groups in the world.
I will move most of my position into Tether and try to buy BTCUSD at a lower price.

There is a possibility for the beginning of an uptrend in WTCETHTechnical analysis:
. Walton/Ethereum is in a range bound and the beginning of uptrend is expected.
. The price is below the 21-Day WEMA which acts as a dynamic resistance.
. The RSI is at 48.
. The price downtrend in the daily chart is broken, so the probability of the resumption of an uptrend is increased.
Trading suggestion:
. There is a possibility of temporary retracement to suggested support zone (0.0084 to 0.0069). if so, traders can set orders based on Price Action and expect to reach short-term targets.
Beginning of entry zone (0.0084)
Ending of entry zone (0.0069)
Entry signal:
Signal to enter the market occurs when the price comes to " Buy zone " then forms one of the reversal patterns, whether " Bullish Engulfing ", " Hammer " or " Valley " in other words,
NO entry signal when the price comes to the zone BUT after any of the reversal patterns is formed in the zone.
To learn more about " Entry signal " and the special version of our " Price Action " strategy FOLLOW our lessons:
Take Profits:
TP1= @ 0.009960
TP2= @ 0.011700
TP3= @ 0.013560
TP4= @ 0.015700
TP5= @ 0.017690
TP6= @ 0.021000
TP7= @ 0.024300
TP8= Free

ETHUSD Short to 160, before rally to high 300sETHs price activity since mid December 2018 has signified a break from the major downtrend we saw off of ETHs ATH and subsequent rapid depreciation. ETH has since then enjoyed a very strong uptrend with growing volume and bullish price activity. Now I believe ETH is set-up to show a repeat of the bullish activity in spring to early summer of 2017, which ETH saw rapid price growth to levels of $400+, but with this bullishness came volatility and after setting a new high ETH came down multiple times under 200.
Watching ETH get set-up for some long term growth and momentum, and the resistance it is running into as seen on the ichimoku cloud, I expect us to see a continued decline in buy volume until ETH goes below 150. After this point, I think we could see a rally from November onwards to the $400 price levels.
Watch for ETH to continue to decline along the edge of the Ichimoku cloud on the weekly chart. I believe now is an optimum time to for me to enter into a short position with a target of $160 or less.
This is not investment advice, you are responsible for your own investment decisions.
Happy trading!

Fun with Fractals: BITCOINAlmost completely identical, will it play out the same way? I think so! COINBASE:BTCUSD

LTC - my point of viewI believe there's a falling wedge formation here and at the exit point I predict an inverse H&S.
My target area is any value inside the rectangle area.
Let's see how will this will play out.


BTC – this is just a correction! Nearly 300% in 3 months.Hi Guys!
Don’t listen to people who say this is the end , BTC is heading to $1000 or to $100.
This didn’t happen and it won’t happen again .
Do you know the counter which counts how many so-called experts claimed BTC dead is ?
Do you know how many times this happened?
Over 360 times .
The last such announcement was marked May 27th 2019.
In 2019 we had 22 of such opinions.
So don’t worry too much .
BTC has grown 300% over the last 3 month.
Investors have to take their profits .
This is perfectly normal and healthy.
We think we should not fall below the level of the $7000 .
Before that, we have 2 other support lines where the price can stop.
$7000 is the 3rd one and the lower one.
Although demand has evaporated temporarily there are also not many people who sell .
When looking at the WBM BUY/SELL Indicator we can see there is room to fall a bit from where we are now.
Anyway, we won’t fall lower than $7000.
Are you feeling better and calmer?
Please do write in the comment section.
Thank you for your time and reading.
Hit a like to support us.
MASSIVE Hugs!
WBM Team.

How will we open orders in this area?In the last 2 weeks, I entered 12 orders and only failed one order
Because I never tried to open the order at the top or the bottom of the wave
I waited for the breakout signals
Follow me for more update Guys!
- Ichimoku Kinkohyo -

Refined Market Reversal for Corny Corn CornBitmex undergoing maintenance on the 4th is a neat event to help trigger an interesting move that will likely happen in the next few days. Purpey lines are a daily structural meme shape I made and Teal is weekly meme lines.
Looking at an escalator top of around 9252 followed by the devil's elevator down very short after.
An idea I appreciate by cryptomedius (twitter @cryptomedius) lays out the historical bull-run-then-large-correction seen in the past by the lord and saviours corn. Obviously this is not guaranteed but history does like to repeat itself.
Would like to see the reaction at 5880 and if not huge demand at those levels with the public and early retail buyers holding poopy bags, it's likely we could see new lows before a move to 100k+.
Who noes tho right?

two options for XRP: both Short than LongI am looking at two possibilities here for XRP. Option A) we see a retracement to the .38 area before resuming the uptrend B) we fall through the structure and see a retest on the .28 area before the next sharp move higher.
Both options see short term weakness followed by a sharp move higher.
We can see BTC here for context, which would seem to confirm a similar move coming; short term downside before resuming uptrend.

BTC – still above 2 important support lines. North is coming.Hi Traders!
This is an update on the current situation on BTC.
Everything is perfectly normal.
The price touched the support at $8200 - $8300 .
We are still above 2 important trend lines .
This looks like a correction. Nothing else.
WBM BUY/SELL Indicator says us the price is in the oversold zone .
This might be the perfect moment to re-buy .
North is the only direction.
Take care.
Have a good weekend.
Don’t panic.
Just observe how your assets are growing.
Thank you for reading.
Hit a like to support.
Massive Hugs!

Pundi X ON THE VERGE TO BREAKOUT.!!!As we can clearly see NPXSBTC is an descending triangle and with the recent volume and push we can see to it that's its gonna make a move in future
we can start accumulating at this range and the targets would be 23-25 sats range giving a 75% gain in a short period of time.
have a stop loss according to your risk management
accumulation range - 11-13 sats
Happy trading.


Bulls overpowering the bears!Ont possibly just made a weak-a$$ 5 waves down. So weak that the 5th wave was truncated. (That means mad bullish, yo!) Buy into the uptrend confirmation. Green box above price or later entry is above B wave break out.
I've been day trading ont since February **********if you'd like to learn something the old thread/ongoing thread is in the comments section.**********

BTC – dominance - peak from 2018 as small as from 2014Hi Guys!
This time let’s take a look at the dominance of BTC .
This is much saturated . Look at RSI. We know the alt season is coming.
BTC has broken previous resistances and its peaks are higher (price in USD).
This is definitely bullish .
When will alts explode ?
This hasn’t happened yet.
We know it will come. Most likely in June . Yes, this June .
Most of the altcoins are much undervalued (ETH, XRP, ONT, ETC, XMR, NEO, XLM).
In fact, 90% of them are really cheap right now.
The current dominance level of BTC is relatively high = 60%.
You see this level most likely for the last time within the next 2 upcoming months.
First, we have to touch 50% and then cross it down.
At the end of the global crypto rally , we can even see the levels such as 30% .
What is more once again our magnificent WBM BUY/SELL Indicator showed a perfect moment to buy BTC. This is on 1M interval.
When we look at the previous height in 2014 it looks so small… like a small puppy. :)
The peak in 2018 is 20 X higher .
This time will be no different .
We aim BTC to be around $400 000 – 20 times higher as it was in 2018.
Thank you for reading.
Have a wonderful weekend.
Hit a like to support .
Who supports such a prediction? BTC = $400 000 :)
Please write in the comment .
Massive Hugs.
WBM Team

Bitcoin printing 2015 pattern that resulted in MASSIVE bull runGood day traders!
As you can see BTC is printing a very similar "cup and handle" pattern from back in 2015 that resulted in the most amazing bull run in recent history.
Just like in 2015 price has bounced off 200 SMA line and broke above 100 SMA line.
If this fractal continues to play out, a pullback to 100 SMA is possible before continuing the bull run. The current bull run could prove to be even more spectacular!


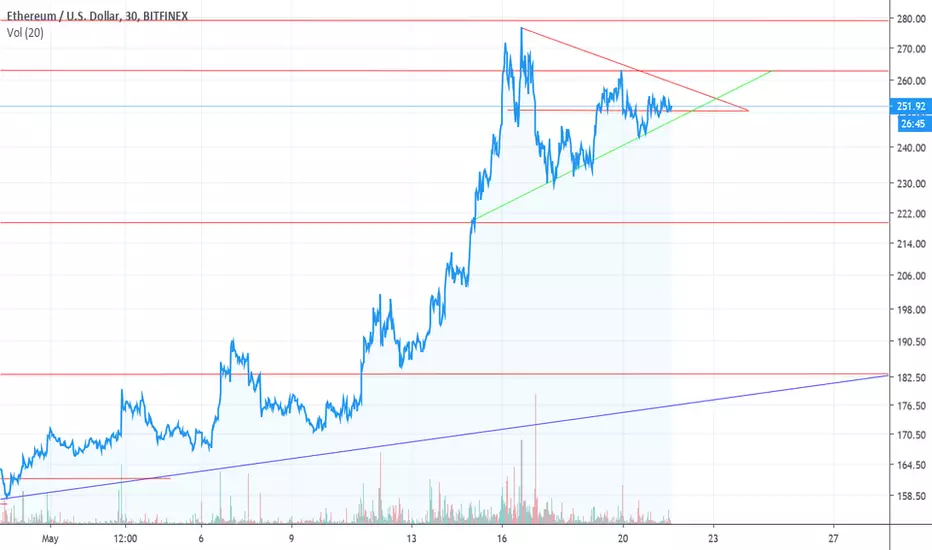
Ascending Triangle or Descending Triangle.Pick your poison.
It appears as though Ethereum is ready to break this Ascending Triangle or break this descending triangle to the downside.
I'm thinking a new ATH is on the horizon.
Time will tell per usual.
Bitcoin - Short-term pullback possible but Weekly Charts UPSome minor negative divergences on the daily charts point to some possible short-term weakness.
But the weeklies show nothing but strength. With that backdrop, its dangerous to try to be too cute and trade short against a strong uptrend.
I'll hold my longs, and possibly add in the 6,000-6,400 area if it gets there and technicals give the green light.

ZIL LONG!Hi the correlation is real on zil and iota ***IF you can't tell I have more defined images in a thread I'll be updating on twitter. Link in comments*****
Anyways, you can long zil and short iota, both with tight stops and one will profit or just long zil.
Thread in comments,
