Crytpocurrency


Ethereum - Head and shoulders potential pattern.I have a potential head and shoulders pattern on the horizon that could play out with a very good risk to reward ratio short upon a neckline break, or $104 support breaking for a more conservative trade. I will only short this on confirmation of support breaking. Of course I will scalp the $100 physiological number where one would expect at least some defence by the bulls should support go. This is also so coinciding with an Elliott Wave count I have for Ethereum where we will come down to at least the 0.618 Fibonacci level ($111) where I will take profits again as the $100 and $110 regions are both support. I must add that I am trading this more off the pattern than the EW count as if we hit target the ABC would be giving back more or less 100% of the move, and the labelling of the waves will be readjusted (Something I will be doing as we move along in real time). There are plenty of opportunities on Ethereum for longs on the way down, but if we break support with volume I will be taking very big short positions on this coin. Of course we have not broken neckline support yet, so the RR for a long at the moment is good on the other end of the spectrum, and should Ethereum break up from here I will be laddering into this coin for a new trade setup. I will hold swing positions and simultaneously scalp this on another exchange should we break down.
The volume profile for me is not the best, but we do have more volume on the on the advance of the left shoulder than the head. One would need an increase in volume to come with a break of the neckline and lower support in order to obtain confirmation.


Bitcoin Losses May ContinueBitcoin has sold off strongly and it may not be over yet. The leading coin found its legs and support was established around 3503 on the Bitstamp Exchange.
But don't get short until the price can confirm further weakness. The market may rally here first and then meet resistance amidst the Super Pivot Stack that is now intact.
If price trades through the previous session's low then look to go short at 3492 and place a stop loss at 3722.
There are 2 profit targets you can aim for, 3125 first, then 2827 if the price weakens further.

Zcash – heavy accumulation on Bithumb – 2000% gain possibleHi Guys!
Today we decided to apply a bit different approach to our analysis.
We noticed a heavy accumulation on ZEC but only on one South-Korean exchange – Bithumb.
This accumulation is seen since October 18 whereas we observed the highest volumes over last 2 weeks.Yesterday, during interview Edward Snowden mentioned ZEC as the most interesting cryptocurrency worldwide. Mainly because of its privacy.
Here are analysis details:
• The price is right now on the very bottom which means we have a great potential to earn money
• Although accumulation started in October 2018 when the price was 3 times higher than it is now it was still very low in comparison to prices at the end of 2017 and at the beginning of 2018.
• Beginning of November 2018 - significant volume but small price change = accumulation
• End of November 2018 - a significant price change with a relatively small volume = short to make the price even smaller to rebuy more for
a lower price
• End of December 2018 - again much volume but no change on the price = accumulation
In terms of 24h volume, ZEC jumped on the 3rd position giving way only ETH and BTC.
We are not sure why only Bithumb faced such a massive volume. Any ideas?
As he is a permanent resident in Russia now he may advise Russia’s government.
Although it is not directly linked with Snowden it might be interesting:
“Because of US sanctions, Russia’s elite is forced to dump US assets and US dollars and invest hugely into Bitcoins. The central bank of Russia sits on $466 billion of reserves and has to diversify in case there are limited opportunities to do it (in the future) … I believe that Russia (Government) will start diversifying its reserves with Bitcoin in February this year when US Congress will introduce new sanctions against Russia, ”Vladislav Ginko, a lecturer at Moscow’s Russian Presidential Academy of National Economy and Public Administration, explains, cited by Ethereum World News.
What do you think guys of ZEC?
Are you more interested in private ledgers?
MASSIVE Hugs!

The Bottom Is Not In!! 1k is coming!Guys, don't listen to the "gurus" who have been saying the "bottom" is in since 6k! Technical analysis IS NOT HARD and in fact very simple. The most consdrvative target of our descending triangle is 1k usd and that is where we are headed at a minimum, I think we will probably get "capituation" in that area and how bitcoin responds at that point will tell us if we have found a bottom or if there is more blood in the streets. So far volume has not shown us a bottom, no capitulation sell off has happened and no giant wicks have occured. A large bull trap/short killer to 4500-5k can not be ruled out but I can PROMISE you the bottom is not in. Trust me lol even though I am not as polished as alot of these guys I have a brain, common sense and zero reason to care or promote bitcoin. Most of these calling bottoms have agendas...beware!
Red Boar

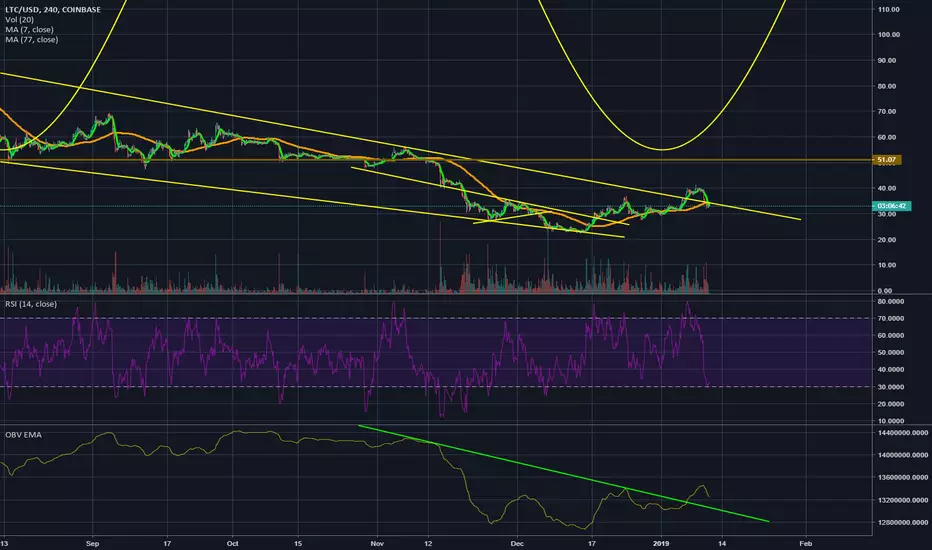
Your Crypto Trading CompassAt this moment this is what I am using to position myself in the crypto markets.
Due to the high correlations between the cryptos everything is in a holding pattern, waiting for BTC to break up/down. There are many alt coin pairs that are itching to be longed waiting for BTC to break the range, my favorites are: ADA/BTC - BCH/BTC - TRX/BTC - LTC/BTC - EOS/BTC.
My gut wants to long it all, but my trading system/strategy has a better ROI than my gut, lol.
I will probably start building long positions in the aforementioned alts do break their local highs while BTC is sideways. The only positions I have right now happens to be the only alt coin that broke it's local range highs, ETH/BTC and ETH/USD. This pair is showing major strength and has plenty of fundamentals to go with it (Constantinople hard fork in few weeks). (As I type this TRX/BTC is trying to local high, will see how it closes)
Hopefully BTC can sack up and break out of zone, then there will be plenty of opportunities for exponential gains in the al/BTC pairs. If it breaks down I will short certain alt pairings along w BTC/USD.
Now if ETH breaks/closes $175, IMO, these alts could run regardless of BTC, so that is something to watch for.
At this moment, the best R:R is is to buy longs at green support one if you are overly bullish, and shorts in red if overly bearish.
When we break these zones up/down, this outlook will have played out and we (the good traders) will evaluate the new evidence for future decision making.
I will be updating this idea as we go, so follow, and like, por favor. Gracias.
Good day Gents,
Sir Lambo Moon
(Sent from Lambo)

ETH/USD COINBASE - SYMMETRICAL TRIANGLE Could this be a symmetrical triangle? Im not leaning bullish nor bearish, but i will set targets for both scenarios;
A symmetrical triangle is a chart formation where the slope of the price’s highs and the slope of the price’s lows converge together to a point where it looks like a triangle.
What’s happening during this formation is that the market is making lower highs and higher lows.
This means that neither the buyers nor the sellers are pushing the price far enough to make a clear trend.
If this were a battle between the buyers and sellers, then this would be a draw.
This is also a type of consolidation.
In the chart above, we can see that neither the buyers nor the sellers could push the price in their direction. When this happens we get lower highs and higher lows.
As these two slopes get closer to each other, it means that a breakout is getting near.
We don’t know what direction the breakout will be, but we do know that the market will most likely break out. Eventually, one side of the market will give in.
So how can we take advantage of this?
Simple.
We can place entry orders above the slope of the lower highs and below the slope of the higher lows. Since we already know that the price is going to break out, we can just hitch a ride in whatever direction the market moves.

BTC – positive ratio on the wealthiest walletsHi Guys!
We checked what happens on the top 100 wealthiest addresses on BTC.
So it doesn’t look bad.
There are as much as 46 wallets that just gather money and not send them out. Wow, this is actually nearly a half.
The next 41 wallets had at least one outgoing operation in 2018.
The rest 13 didn’t have any outgoing operation had at least one such operation in 2017 or earlier.
Moreover, the ratio of incoming operations to outcoming operations is positive. Of course, each operation may contain different amount of BTCs but as we can follow these wallets it is easy to observe that the majority of them is actually growing in terms of an amount of BTC.
Furthermore, as we mentioned in our previous analysis somebody has bought 3 bln USD worth BTC at the beginning of December 2018. A well-informed person?
They created multiple BTC addresses transferring 8000 BTC on each wallet address.
This set of wallets starts at number 126 from the richest wallets on BTC network.
You can check it on explorer.
Technical analysis details:
• Visible range – we touched the bottom of Value Area marked since the beginning of 2017
The point of control = fair price at $6720
Mid-term target - the top of Value Area.
• Bollinger Bands – we are right now in the middle of the “decider” zone
If we manage to bounce up from the $3715 region we can count on a couple of days of growth. Target would be $4300
If we fall target $3125
• Weis Waves - not much volume on the correction which is a good sign – green wave expected
• Sentiment Zone Oscillator - still a bit of room for the price to be saturated (pumped) - just crossed the signal line.
Guys, what are your forecasts? Are you more optimistic or pessimistic? Please do share your thought with us in the comment section.
If you would like to help us and motivate us even stronger please don’t forget to give us a like. It is always highly motivative.
MASSIVE Hugs!
WBM Team

A trading opportunity to buy in QTUMBNBTechnical analysis:
. QTUM/BINANCECOIN is in a range bound and the beginning of uptrend is expected.
. The price is below the 21-Day WEMA which acts as a dynamic resistance.
. The RSI is at 51.
Trading suggestion:
. There is a possibility of temporary retracement to suggested support zone (0.39500 to 0.32470). if so, traders can set orders based on Price Action and expect to reach short-term targets.
Beginning of entry zone (0.39500)
Ending of entry zone (0.32470)
Entry signal:
Signal to enter the market occurs when the price comes to " Buy zone " then forms one of the reversal patterns, whether " Bullish Engulfing ", " Hammer " or " Valley " in other words,
NO entry signal when the price comes to the zone BUT after any of the reversal patterns is formed in the zone.
To learn more about " Entry signal " and the special version of our " Price Action " strategy FOLLOW our lessons:
Take Profits:
TP1= @ 0.48070
TP2= @ 0.54410
TP3= @ 0.67870
TP4= @ 0.79280
TP5= @ 0.92970
TP6= @ 1.02900
TP7= @ 1.20550
TP8= @ 1.38640
TP9= @ 1.64630
TP10= Free

Very Short Term Bitcoin Short, RSI Divergence into ResistanceAs Bitcoin met expected resistance around $4,100...I am entering a short term short position.
Note the RSI divergence on the hourly chart, and such divergence, when it occurs at a resistance (or support the other way) carries more weight than a random one. I'm looking for bitcoin to come back at least to $3,874.
But more than a short, I've sold an amount of hodl alt coins to buy back at lower price, possibly as soon as later today. Volatility is back :).
If bitcoin pops through and makes a higher high for this move, use that as a stop, otherwise, I'll wait to see if stochastic can cycle back down and reevaluate.
Travis
JMJ - UIOGD

Digibyte! Will History Repeat? DGBWill history repeat again for Digibyte? Not much more to add... it's color coded.
Travis
JMJ - UIOGD


BTCUSD BEARISH PATTERN STILL WORKINGBitcoin remains under technical selling pressure on Wednesday, with the number one cryptocurrency trading close to its 2018 trading low, at $3,196. The bearish head and shoulders pattern on the lower timeframes has yet to reach its full downside projection, close to the $2,700 level. Overall, the BTCUSD pair is likely to continue to drift lower unless buyers can perform a sustained recovery above the $3,500 level.
The BTCUSD pair is strongly bearish while trading below the $3,500 level, key support is located at the $3,196 and $2,700 levels.
If the BTCUSD pair moves above the $3,500 level, a correction towards the $3,700 and $4,000 levels remains possible.


Stellar Lumens long term chart After the sharp rise last year lumens have formed a giant consolidation symmetrical triangle marked by orange, and has been riding a medium term uptrend marked in blue. Movement out of this triangle should be considerable. Fibonacci retracement levels have been in play.

UPDATED ZEC count. Wave 3 incoming!!Coinbase just listed ZEC. Bitcoin most likely has one last dip left in it. Then we can start the road to recovery. With being easily purchased on Coinbase ZEC will do good in upcoming hype cycle. Green box area is for scaling in.
If writing wont show up on image then the full image is in comments section.

XRP - SO MUCH CONFLUENCE FOR UPSIDE!Hi Traders, Hope you are all well. This is My current view of XRP/USD
- I belive we have Made a clear impulse to the upside from $0.25 - $0.80
- Followed by an ABC Corrective Wave and we are ready for upside (I also follow the fundamentals and partnerships of Ripple the company and their actual product is now live XRAPID)
- Also we are now on the way to complete a Shark Pattern Which is a high win rate harmonic , I don't trade harmonics but i draw their completion zones and fib levels to add extra confluence for my target taking.
- The market has now printed My ideal entry which is a flag pattern which meets my requirements as a Trend Continuation Pattern which is what i use to enter the market and join the trend.

KEY triangle breakoutOur eyes on KEY. Getting close to triangle trendline with possibility of breakout towards 115 – 125 – 139. I can see here only two bullish scenarios. One is when the price returns back to ~97 and then bounce up. Another for direct “fly to the moon”.
Day chart for overview.

BCH falling wedge. Doesn't get any better than this.Falling wedge shows that the sellers are gone and it's looking to breakout. Buying opportunity of a lifetime.
