Reversal signals apparent can the bulls push through today?*DISCLAIMER: I am not a financial advisor and this is not financial advice as these are purely my opinions and speculations. I may also own or trade any of the symbols and cryptocurrencies mentioned in this video so do not make your trading or investing decisions based on this video. I do not guarantee any results nor am I responsible for your actions. You should always do your own due diligence before trading or investing in this market as it is extremely risky.
Affiliate links are also included in this same video description section here and if you decide to support me by using any of them, I may receive a referral bonus or commission.
*Follow me for the latest cryptocurrency analyses on my watchlist
*Thank you to those who donated, I very much appreciate it.
*Let me know in the comment section if you agree or disagree, would love to hear your ideas too.
Crytpotrading

This is how to get hugh profits in trading Hi there Fellow traders,
We hope all of you are well.
In this example we want to show you how to get those big wins when trading cryptocurreny and stocks.
the signal was given a couple of days in advance, so we were well prepared.
Stay safe and happy trading

Making killergains trading BTC on the 30minHi there fellow traders,
We wanted to show you this clear example of why our indicator is such a powerfull tool to work with.
We made killer profits over the last couple of days, trading the 30min timeframe.


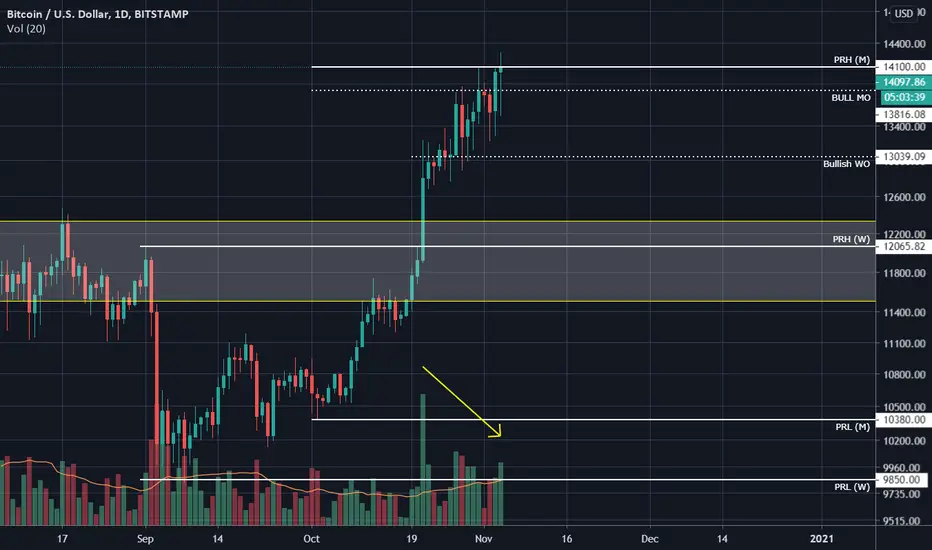
It's Hard to be bullish Price is at $14K, to me it's struggling at this level, below the previous Monthly range high, all this bullish price action
does is confirm for me that $12K has turned into solid support. I will be eyeing $13K and ideally $12K for longs
until then this imo this could be bulltrap but I could be wrong. Either way there will always be another long
opportunity but RR isn't favorable here and I see $12K as a magnet zone which price will return to at some point
#BTSBTC History Will Repeat itself. Get ready to go to the moon.Bitshares is an ancient and powerful currency. He created the first defi and the first dex bit shares. Now the price is in the buy zone. Do not regret it in the future.
Get ready to go to the moon.

LiteCoin LTC Looks GoodI'm looking at a decent +20% trade with COINBASE:LTCUSD
At the end of this month (October) we could see LTC price ≈ $64
I can see it getting to the $84 price range by the end of the year. Which would mean that November would be a great month for LTC.
Hitting GANN resistance and support nicely
At the bottom of long term trend
Bullish symmetrical triangle
$54.54 - end of this week would make this a go. LiteCoin might have something in the works that will be good publicity which would further support this move. And potentially make this time frame a lot quicker.
Have fun trading!
Not financial advice.

Bitcoin Analysis Shows Current Air Gap In Trading OpportunityUsing a 12-hour chart and Ichimoku Cloud indicator we see an area below cloud and above the current support level where BTC prices are currently trading.
The bottom of the cloud also aligns with the downtrend produced by the decline since August.
A break into the cloud and above that trendline of resistance would indicate a good trading entry for both manual traders and algo bots.
By that point we can expect volatility to come back into the market and hopefully a clear price direction.
Currently we can also see from the MACD at the bottom of the chart how choppy the market is from day to day with no clear trend in MACD shown.
Now is a difficult time for traders to find profit.
Note: SparksterSignals (including our technical analysis and our algorithmic backtested signals) are not provided as financial advice.

Bitcoin close to 10000,00Firstly, please support our work by clicking like button & or following! These really assist us to reach more investors & traders like you! Bitcoin slides below 10K. At current levels technicals are on the side of bears.

DUSK - Gem that you haven't found yet (10x)First of all, always DYOR. I don't give finance advices, it's all speculation.
DUSK is something that i have been doing research for days now and i am impressed. It has pretty low MC (25 mil) and haven't really blow up again after being listed to binance last summer when it was up +80% of its current valuation.
There is many bullish points i could make about DUSK, but lets just say the latest. Today DUSK announced that they are part of the IWA (InterWork Alliance). DUSK is now part of Alliance where you can find cryptos like LINK and HBAR.
What comes to technical analysis, it looks like DUSK has formed 2/3 Elliots waves pulses and last, typically the biggest in crypto markets, is still yet to come. Fib levels have worked perfectly and is alligned currently with pitchfork. This is great level to jump in, but be careful if BTC starts moving again.

MARATHON Patent GroupEarnings getting better, await Bitcoin/Etherium/crypto spikes. Following top 10-15 looking for when 3 then 4 then 5 hit double digit jump in daily value to make MARA watch for jump, or earnings from revenue.

DOT IS HOT ...WHEN WILL IT DROP ?hoping we get a nice pull back on dot , if its extremly deep im really gonna get in long !!!

Through the Eye of The NeedleZen has been head faking a breakout that is more than due. The bottom trend line has held strong and a double bottom pattern has formed. The longer it takes to breakout, the greater the upside.
THIS IS NOT FINANCIAL ADVISE; CRYPTO IS HIGHLY VOLATILE.


Flash Crash Fully AbsorbedAfter the huge volatility wick on 2nd August we need to give the market a bit of breathing space to decide if it's the start of an extended decline, or if supply is quickly absorbed and new highs are to be tested.
In this case it certainly seems it was a minor blip with a bit of downwards drag on the market for these past couple days, but prices are already edging back up to resistance.
Tinken-san has already crossed back above the kijun-san level on the Ichimoku. MACD is pointing up. Stochastic RSI has just emerged from oversold condition.
A break above the local high shown here on the 4-hour timeframe will signal another extended rally for ETH and the alt market. With a series of higher lows, the triangle may already be set to break to the upside by end of tomorrow.
Note: SparksterSignals are not provided as financial advice.


First XRP Breakout of 2-Day Cloud Since Previous ATH
In our previous analysis of XRP we said "If XRPBTC can reclaim the white horizontal level then the historical trend easily comes into play. A sharp burst of 300% profit potential."
Hey presto it has now reclaimed that level:
Furthermore... using 'crypto settings' for Ichimoku Indicator we can also see a 2-day time-frame break above the cloud. That's the first breach of that dynamic resistance since the previous bull run.
Traders will be getting very keen on XRP trades.
XRPArmy... rise and shine.
- Note: SignalsBySparkster are not provided as financial advice.

ETherum Long term Secenario as per TAPrice of ETH is expected to Rise once it gives correction before that do not jump into the market

Bitcoin Weekly Candle ReviewHigher time-frames have more influence then lower time-frames. With the weekly candle close showing almost no movement, a peak at the 2-week time-frame reveals short-term moving averages showing a top-heavy formation. This suggests price could move down. MACD confirms downwards direction too.
We also see a double top (green circles).
A burst to the upside would come as quite a surprise.
The weekly time-frame itself shows slight upwards momentum.
So overall for now we remain Neutral on BTCUSD.

BTC/USD Retracement Level - Looking for LONG PositionThe market in BTC/USD has been consolidating recently and will potentially breakout to the downside. If it does this, I am looking for a retracement to around the $7000 level. This area shows previous demand along with alignment with Fib retracement levels. If the price action shows consolidation and interest to hold at that level, there is a good potential for a LONG position up to the 1.382 extension level.

Bitcoin Daily Expansion Phase?BINANCE:BTCUSDT
Is Bitcoin chewing up orders and liquidity in a bearish expansion phase or have we just packed our bags to the moon?
Right now a whole lot of shorts are being squeezed and stopped out, meanwhile a whole lot of long stops are building up under the previous consolidation area.
I'll be watching price on the 4H and 1H in hopes of riding a short order back into at least the consolidation area.
I'll post any lower time frame set ups i see and take.

Chainlink is revving its enginesEven with the current BTCUSD drop, LINKUSD has already rebounded, pushing against its ATH resistance.
When the market starts to move up again, SparksterSignals is expecting strong performance from Chainlink.

Bitcoin - Everything is turning red. :-( This level fails soonI keep trading as simple as possible and bitcoin looks in trouble.
Don't get greedy. Take profits quick when in green :-)
All trades taken on PrimeXBT (Referrel link below). Write me for 50% off trading fees.
go.primexbt.com
Cheers.
