CTKUSDT at Critical Retest After Major Trendline Break!CTK/USDT has successfully broken out of a long-term descending trendline that has dominated the price since November 2024, signaling a potential trend reversal from bearish to bullish. The price is now retesting a crucial supply-turned-demand zone in the $0.36 - $0.39 area, which now acts as new support.
📊 Pattern and Price Structure
Descending Trendline Breakout: A clear breakout above the long-term downtrend, indicating the start of bullish sentiment.
Key Zone (Yellow Box): The $0.36 - $0.39 area previously acted as resistance multiple times and is now being tested as support.
Potential Reversal Pattern: The overall structure resembles a possible Inverse Head & Shoulders, with a neckline around $0.43.
---
🟢 Bullish Scenario
If the price holds above $0.36 and breaks through the minor resistance at $0.4323:
Next bullish targets are:
$0.5217
$0.7036
$0.8826
Up to $1.0151 as a major historical resistance
A breakout above $0.4323 with strong volume would confirm the bullish continuation.
---
🔴 Bearish Scenario
If the $0.36 support fails to hold:
Potential downside levels to watch:
$0.31
$0.26
Down to the key low at $0.21
A breakdown of this zone would invalidate the reversal setup and suggest continuation of the downtrend.
---
📌 Conclusion
CTK is at a critical decision point. The breakout from the downtrend is an encouraging signal, but its validity depends on whether the price can hold the new support and push above the next resistance. Volume confirmation will be key to identifying the next move.
#CTKUSDT #CryptoBreakout #AltcoinAnalysis #TrendlineBreakout #TechnicalAnalysis #SupportResistance #CryptoSetup #BullishReversal #CTKAnalysis
Ctkusdt

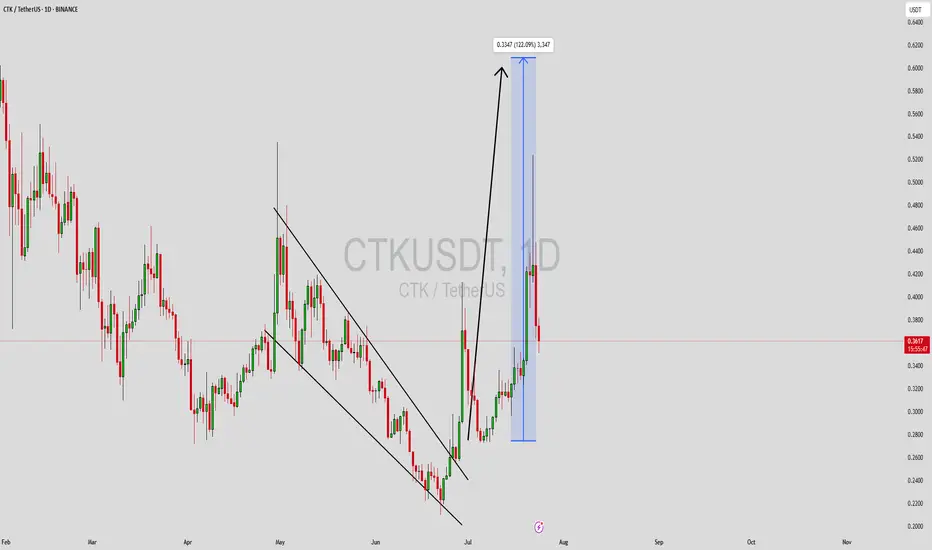
CTKUSDT Forming Falling WedgeCTKUSDT is currently trading within a well-defined falling wedge pattern, a classic technical indicator that often signals a bullish breakout. The structure reflects a period of consolidation after a prolonged downtrend, with gradually narrowing price action hinting at a potential reversal. Volume remains healthy, suggesting sustained market interest and accumulation at lower levels. With expectations of a 110% to 120% gain, CTK appears poised for a breakout that could catch the attention of momentum traders and longer-term investors alike.
The falling wedge is known for its high-probability breakout potential, especially when accompanied by consistent volume and investor accumulation. CTKUSDT has shown multiple rejections at resistance while maintaining higher volume spikes on up moves—indicative of strong buyer interest. As it approaches the apex of the wedge, a breakout above resistance could ignite a strong bullish rally, particularly if confirmed by increased volume and a close above key moving averages.
CertiK (CTK) has garnered notable attention in the blockchain security space, offering real-time auditing and on-chain monitoring services. With rising concerns around security and smart contract vulnerabilities, projects like CertiK are becoming increasingly relevant. This fundamental strength adds further confidence to the technical bullish outlook for CTKUSDT.
Traders and investors should closely monitor this setup. A breakout from the wedge may lead to a sharp move, creating an excellent entry opportunity with favorable risk-reward. If the current structure holds and breaks upward, the target zone of over 100% upside is a realistic and achievable move based on historical wedge performance.
✅ Show your support by hitting the like button and
✅ Leaving a comment below! (What is You opinion about this Coin)
Your feedback and engagement keep me inspired to share more insightful market analysis with you!
CTKUSDT Forming Strong Bullish ReversalCTKUSDT is currently displaying a strong bullish reversal setup with a well-formed falling wedge pattern on the chart. This classic pattern is known for signaling a potential breakout after a period of consolidation and downward pressure. As the price approaches the apex of the wedge with increasing volume, technical traders are eyeing a potential breakout to the upside, which could yield gains in the range of 90% to 100%+ based on historical wedge breakouts.
The volume dynamics are aligning with the price structure, suggesting accumulation at lower levels. This behavior often precedes major bullish moves, particularly when supported by a clear technical base. The falling wedge breakout, if confirmed with a daily close above the upper trendline, could open the doors to a strong bullish trend, especially with broader market sentiment showing signs of recovery.
Investor interest in CTKUSDT has been steadily growing, and recent market developments suggest that the project is gaining attention for its fundamentals as well. This makes the current technical setup even more compelling, as it combines strong chart signals with improving investor confidence. The 1D chart structure supports a bullish narrative, and traders should watch for volume spikes and retest confirmations after breakout for added validation.
Given the confluence of technical patterns, volume behavior, and growing market engagement, CTKUSDT stands out as a high-potential altcoin poised for an aggressive move. Traders looking for breakout opportunities in the current crypto cycle should keep a close eye on this pair.
✅ Show your support by hitting the like button and
✅ Leaving a comment below! (What is You opinion about this Coin)
Your feedback and engagement keep me inspired to share more insightful market analysis with you!

Shentu Back To Baseline, 200% Minimum, Fast!We have a very good chart setup here but I will focus on one target only and the short-term, "back to baseline."
Shentu is about to make a strong jump. One of those that can leave us with our mouths wide open. Similar to 30-April but without the rejection and lower low.
This time, the jump will result in long-term growth. Of course, there can be some daily growth first before this jump. The 200% profits potential target is the minimum, there is huge potential for growth, CTKuSDT, long-term. As well as mid-term. And I am telling you now about the short-term, so everything is pointing up.
The main low happened in April. The recent lower low is a form of consolidation with a bearish bent. This type of consolidation can produce higher lows or lower low but the end result doesn't change, which is a strong rise with a higher high compared to the last high.
This is one is good and already on the move. Four days green, but this is only the start.
Thank you for reading and good profits. It will be great.
Namaste.

CTKUSDT | Critical Resistance Levels ConfirmedCTKUSDT is currently testing a key resistance area, and the blue boxes have proven to be robust resistance levels. These zones have consistently repelled upward movement, indicating strong selling pressure at these levels.
Key Observations
• Strong Resistance Areas: The blue boxes mark critical points where sellers dominate, making any bullish breakthrough challenging.
• Confirmation is Essential: I rely on clear low timeframe (LTF) breakdowns combined with CDV and volume confirmations to validate my setups. Without proper confirmation, no trade is taken.
• Adaptive Approach: While the current setup points to resistance, if the price breaks above these levels with significant volume and retests them as support, I will quickly reassess my bias.
How to Trade
If the price approaches and reacts negatively at the blue boxes, it presents a prime short opportunity. I will wait for LTF signals before entering.
In the event of a strong breakout with volume followed by a retest, I will adjust and consider a long entry instead.
The strategy is data-driven and disciplined—no emotional decisions, only precise execution based on market signals.
Why Trust This Analysis
I trade with a level of expertise that sets me apart from the average trader. My analysis is backed by years of experience and a track record of high success, which you can verify on my profile. Most traders simply guess, but I use proven methodologies to pinpoint exact resistance and support levels. Follow these insights to enhance your edge and trade with confidence.
📌I keep my charts clean and simple because I believe clarity leads to better decisions.
📌My approach is built on years of experience and a solid track record. I don’t claim to know it all but I’m confident in my ability to spot high-probability setups.
📌If you would like to learn how to use the heatmap, cumulative volume delta and volume footprint techniques that I use below to determine very accurate demand regions, you can send me a private message. I help anyone who wants it completely free of charge.
🔑I have a long list of my proven technique below:
🎯 ZENUSDT.P: Patience & Profitability | %230 Reaction from the Sniper Entry
🐶 DOGEUSDT.P: Next Move
🎨 RENDERUSDT.P: Opportunity of the Month
💎 ETHUSDT.P: Where to Retrace
🟢 BNBUSDT.P: Potential Surge
📊 BTC Dominance: Reaction Zone
🌊 WAVESUSDT.P: Demand Zone Potential
🟣 UNIUSDT.P: Long-Term Trade
🔵 XRPUSDT.P: Entry Zones
🔗 LINKUSDT.P: Follow The River
📈 BTCUSDT.P: Two Key Demand Zones
🟩 POLUSDT: Bullish Momentum
🌟 PENDLEUSDT.P: Where Opportunity Meets Precision
🔥 BTCUSDT.P: Liquidation of Highly Leveraged Longs
🌊 SOLUSDT.P: SOL's Dip - Your Opportunity
🐸 1000PEPEUSDT.P: Prime Bounce Zone Unlocked
🚀 ETHUSDT.P: Set to Explode - Don't Miss This Game Changer
🤖 IQUSDT: Smart Plan
⚡️ PONDUSDT: A Trade Not Taken Is Better Than a Losing One
💼 STMXUSDT: 2 Buying Areas
🐢 TURBOUSDT: Buy Zones and Buyer Presence
🌍 ICPUSDT.P: Massive Upside Potential | Check the Trade Update For Seeing Results
🟠 IDEXUSDT: Spot Buy Area | %26 Profit if You Trade with MSB
📌 USUALUSDT: Buyers Are Active + %70 Profit in Total
🌟 FORTHUSDT: Sniper Entry +%26 Reaction
🐳 QKCUSDT: Sniper Entry +%57 Reaction
📊 BTC.D: Retest of Key Area Highly Likely
📊 XNOUSDT %80 Reaction with a Simple Blue Box!
📊 BELUSDT Amazing %120 Reaction!
I stopped adding to the list because it's kinda tiring to add 5-10 charts in every move but you can check my profile and see that it goes on..

CTK/USDT in Danger? Key Levels That Will Decide the Next MoveYello, Paradisers! Is CTK/USDT on the verge of a major breakdown, or will bulls make a comeback? Let’s dive in!
💎#CTKUSDT has broken below its ascending channel, signaling a potential trend shift. Right now, the $0.41 - $0.42 level, which previously acted as strong support, has turned into resistance. This is a critical area if buyers fail to reclaim it, the selling pressure will likely continue. Adding to the bearish outlook, price is trading below both the EMA 50 and EMA 200, further confirming that sellers remain in control.
💎A fair value gap (FVG) near $0.41 could act as a magnet for a short-term bounce, but unless price reclaims this level with strength, the downtrend remains intact. If the rejection plays out, the next target to the downside is $0.3484, with a deeper drop potentially reaching the major support zone at $0.3091.
💎On the flip side, a break above the major supply zone at $0.4631 would completely invalidate the bearish setup and open the door for another strong rally. However, as it stands, the market structure favors further downside, and a rejection at resistance could accelerate the decline.
MyCryptoParadise
iFeel the success🌴

CTKUSDT 1WCTK ~ 1W Analysis
#CTK This is the lowest support for now. If you still have a Conviction on this Coin, Maybe this support you can consider to start buying again.

QTUMUSDT UPDATEQTUMUSDT is a cryptocurrency trading at $3.555. Its target price is $5.500, indicating a potential 50%+ gain. The pattern is a Bullish Falling Wedge, a reversal pattern signaling a trend change. This pattern suggests the downward trend may be ending. A breakout from the wedge could lead to a strong upward move. The Bullish Falling Wedge is a positive signal, indicating a potential price surge. Investors are optimistic about QTUMUSDT's future performance. The current price may be a buying opportunity. Reaching the target price would result in significant returns. QTUMUSDT is poised for a potential breakout and substantial gains.

CTKUSDT 1WCTK ~ 1W
#CTK Technically, this coin has successfully made the transition from bear to bull, buy from here if you still have Conviction on coins with a minimum target of 20%++

Ctk/UsdtBINANCE:CTKUSDT
"CTK price is currently at 0.02078 🪙. If the price holds here, the next resistance levels are:
🔝 0.02400
🔝 0.02856
🔝 0.0300
If the price doesn’t hold, the potential support levels to watch are:
🛑 0.01800 (not a confirmed support yet)
⚠️ **Not Financial Advice** – Please do your own research before making any decisions."

CTKUSDT | %756 Daily Volume Spike Dont Sleep on This!CTKUSDT Daily Analysis
Volume Surge: Daily trading volume has increased by 756%, signaling a notable rise in market activity.
Demand Zones:
Below Green Line: Key levels where potential demand zones are identified.
Blue Box: Highlighted as a favorable area for buyer activity.
I keep my charts clean and simple because I believe clarity leads to better decisions.
My approach is built on years of experience and a solid track record. I don’t claim to know it all, but I’m confident in my ability to spot high-probability setups.
My Previous Analysis
🐶 DOGEUSDT.P: Next Move
🎨 RENDERUSDT.P: Opportunity of the Month
💎 ETHUSDT.P: Where to Retrace
🟢 BNBUSDT.P: Potential Surge
📊 BTC Dominance: Reaction Zone
🌊 WAVESUSDT.P: Demand Zone Potential
🟣 UNIUSDT.P: Long-Term Trade
🔵 XRPUSDT.P: Entry Zones
🔗 LINKUSDT.P: Follow The River
📈 BTCUSDT.P: Two Key Demand Zones
🟩 POLUSDT: Bullish Momentum
🌟 PENDLEUSDT: Where Opportunity Meets Precision
🔥 BTCUSDT.P: Liquidation of Highly Leveraged Longs
🌊 SOLUSDT.P: SOL's Dip - Your Opportunity
🐸 1000PEPEUSDT.P: Prime Bounce Zone Unlocked
🚀 ETHUSDT.P: Set to Explode - Don't Miss This Game Changer
🤖 IQUSDT: Smart Plan
⚡️ PONDUSDT: A Trade Not Taken Is Better Than a Losing One
💼 STMXUSDT: 2 Buying Areas
🐢 TURBOUSDT: Buy Zones and Buyer Presence

CTKUSDT (Shentu) Updated till 22-10-24CTKUSDT (Shentu) Daily timeframe range. its still in its local low level holding for a while. at this point if it can hold at this level it got potential for a move. first need to break clean 0.7119. local support at 0.4894.

CTK looks bullishIt looks like we have a large diametric on the chart that we are now in the F wave selection.
By maintaining the green range, it can move up to complete the G wave.
Closing a daily candle below the invalidation level will violate the analysis.
For risk management, please don't forget stop loss and capital management
Comment if you have any questions
Thank You

CTK NEW INCREASE VOLUMEAT this time where BTC depends on TA on the breakdown trend there are low coins that can have a long trend.
CTK is one of the coins that can show new growth.
With the coming time frames, check the trends for confirmations and breaks.

CTKUSDT(Shentu) Daily tf Range Updated till 14-06-24CTKUSDT(Shentu) Daily timeframe range. closely if you look at the chart its a high risk and reward Price action. so have to trade carefully. now if it fails at 0.8176 it will lead to 0.6239. but if it defends 0.8176 that will lead to a retrace back.

CTK LOOKS BULLISH (1D)We have good bullish confirmations on the chart. (iBOS and CH and broken trigger line)
If a pullback occurs on the green level, it is a good opportunity for buy/long positions.
The targets are marked on the chart
Closing a daily candle below the invalidation level will violate the analysis
For risk management, please don't forget stop loss and capital management
When we reach the first target, save some profit and then change the stop to entry
Comment if you have any questions
Thank You

CTKUSDT(Shentu) Daily tf Range Updated till 29-05-24CTKUSDT(Shentu) Daily timeframe range. massive pump here today got over 2 resistances. but yet to confirm breakout which we will know after daily close. this can be a wickout too so gotta be careful. breaking clean 1.2277 will lead it to 1.6009.

CTKUSDT Sell IdeaBINANCE:CTKUSDT has been in bearish trend. Currently, It's retracing towards fib 50-75% levels where we have confluence of descending trendline retest. We can look for short setups in that zone.

CTK - Breakout from the channel - Short Trade#CTK/USDT #Analysis
Description
---------------------------------------------------------------
+ CTK has clearly established a well-defined channel, and currently, the price is breaking downward from this channel.
+ This signals a bearish trend, offering a potential opportunity for a short trade.
---------------------------------------------------------------
VectorAlgo Trade Details
------------------------------
Entry Price: 0.8780
Stop Loss: 0.9558
------------------------------
Target 1: 0.8236
Target 2: 0.7732
Target 3: 0.7342
------------------------------
Timeframe:4H
Capital Risk: 1-2% of trading capital
Leverage: 5-10x
---------------------------------------------------------------
Enhance, Trade, Grow
---------------------------------------------------------------
Feel free to share your thoughts and insights.
Don't forget to like and follow us for more trading ideas and discussions.
Best Regards,
VectorAlgo

CTK/USDT Ready to Resume its Bullish Momentum? 👀🚀CTK Analysis💎Paradisers, let's turn our attention to #CTKUSDT, where current trends hint at a potential bullish rally emerging from its crucial support zone.
💎An analysis of #Shentu's recent market dynamics reveals an impressive 48% surge from its recent peak and hit a resistance zone. However, the resilience observed at the $0.712 support level suggests a gateway to an upward trajectory.
💎Despite facing challenges in surpassing previous highs, leading to a temporary bearish sentiment, the $0.712 support level holds pivotal importance for #CTK. It stands on the brink of triggering a significant bullish surge with a fresh evaluation.
💎As forward-thinking traders, we always have a Plan B ready. If #CTK sees a further decline from this support, we are prepared for a bullish resurgence starting from the secondary support at $0.64. It's crucial to note, though, that a dip below this threshold could signal the onset of deeper bearish trends.
💎Maintain flexibility in your trading strategies and keep a sharp eye on market movements, Paradisers. Your ParadiseTeam is diligently monitoring, ready to navigate you through these evolving market landscapes.

CTK/USDT Ready for an Upward Momentum | 👀🚀CTK Analysis💎Paradisers, let's focus on #CTKUSDT, as the current trends offer a glimpse of a potential bullish turnaround from its essential support zone.
💎A review of #Shentu's latest market activity reveals a considerable 38% drop from its recent high. Yet, the tenacity shown at the support level of $0.612 suggests a doorway to an upward movement.
💎Despite the hurdles in achieving new highs or surpassing previous landmarks, which has led to a temporary bearish sentiment, the $0.612 level is crucial for #CTK. This point is on the cusp of initiating a substantial bullish wave with a fresh assessment.
💎As forward-looking traders, we're perpetually equipped with a Plan B. If #CTK declines further from this support, we're poised for a bullish comeback starting from the secondary support at $0.578. It's important to acknowledge, however, that a descent below this marker could indicate an onset of more profound bearish trends.
💎Maintain adaptability in your trading strategies and keen vigilance on market trends, Paradisers. Your ParadiseTeam is diligently tracking, ready to guide you through these evolving market conditions.

CTK/USDT Still Strong 💪
The current market structure for CTK/USDT remains bullish. I anticipate a potential 20-40% bullish movement in the upcoming days. However, please note that this statement is based on personal observation and should not be considered as financial advice. Invest wisely and conduct thorough research before making any trading decisions. 🚀📈🔥

CTKUDT 80%+ Profit Symphony in Mid-Term PlayCTKUDT is experiencing a fiery surge as the bulls triumphantly safeguard the demand zone.
Before this, a pivotal breakthrough above the descending channel has been observed, marking a significant trend shift.
The current landscape unmistakably favors the bulls, and we anticipate a solid profit potential exceeding 80% in the mid-term. CTK is likely to be a standout performer in the current market heat.
