CTSI About to Detonate? Yello Paradisers! Are you ready before CTSI makes its next explosive move? Because this setup is flashing signals that most traders will only realize when it's already too late.
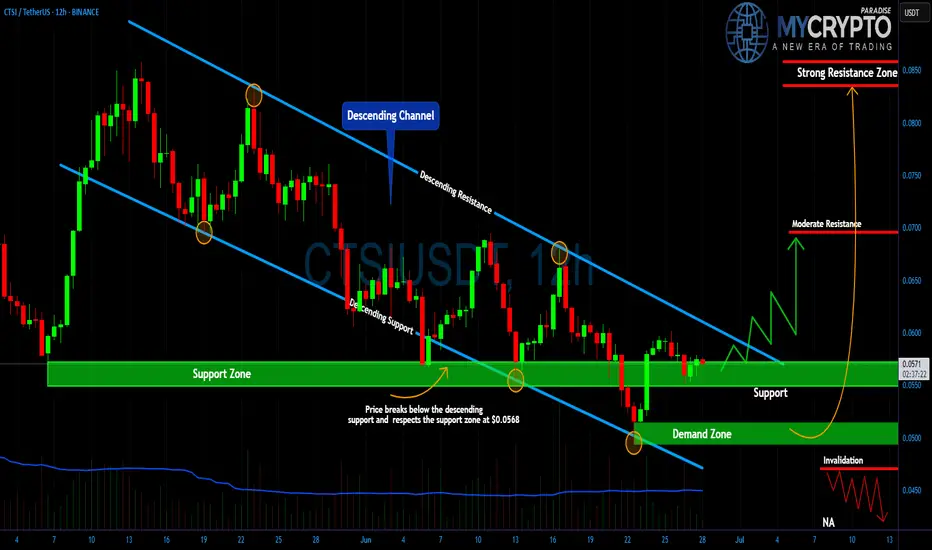
💎#CTSI/USDT has been trading within a clearly defined descending channel, consistently respecting both the resistance and support trendlines. What's important now is how the price has reacted after dipping into the lower boundary. After breaking slightly below the descending support, the price immediately rebounded from the key horizontal support area at $0.0552 a region that has repeatedly proven its strength over the last few weeks.
💎This recent price action confirms strong buyer interest at the current levels, and as long as the $0.0550–$0.0570 zone holds, #CTSI remains in a potential accumulation phase. The reaction here suggests that smart money might be stepping in early, preparing for a breakout move that could take retail traders by surprise.
💎If momentum begins to build and the structure breaks above the descending resistance line, the first technical obstacle will be around $0.0700 a moderate resistance that has capped price action before. A sustained move through this level would confirm the breakout, with the next key target sitting at the strong resistance zone near $0.0850. This would represent a solid bullish extension for those positioned early inside the channel.
💎However, the invalidation point is also very clear. A breakdown below the $0.0500 region, where the final demand sits, would invalidate the bullish setup and open the door to deeper downside. For now, though, the structure is favoring a potential reversal, and the market is giving us a clean range to work with.
Strive for consistency, not quick profits. Treat the market as a businessman, not as a gambler.
MyCryptoParadise
iFeel the success🌴
CTSIUSD
CTSIUSDT 1WCTSI ~ 1W Analysis
#CTSI Buy gradually from here if you still have a Conviction on this coin with a short -term target of at least 20%+.

CTSIUSDT 1WCTSI ~ 1W Analysis
#CTSI Buy gradually from here if you still have a Conviction on this Coin with a minimum target of 20%+.

CTSIUSDT 1WCTSI ~ 1W Analysis
#CTSI In Time Frame 1W re -test this support block, buy from here if you still have a Conviction on this Coin with a minimum target of 20%++

CTSIUSDT 1WCTSI Update ~ 1W
#CTSI If you still have Conviction on this coin,. This support block would be a very good place to start buying back,. with a target of at least 20%+ from here.

CTSIUSDT Analysis: Patience is KeyBuyers are currently active in CTSIUSDT, but it’s wise to wait for the blue box, which represents a meaningful demand zone.
Key Insights:
Active Buyers: Although there’s buying activity, the blue box offers a safer entry with better risk-reward.
Market Conditions: Waiting for lower levels is a calculated approach given current market risks.
Confirmation Checklist:
When trading the blue box, I will confirm using:
Cumulative Delta Volume (CDV)
Liquidity Heatmap
Volume Profile
Volume Footprint
Upward Market Structure Breaks on Lower Time Frames
Learn Advanced Trading Techniques:
Interested in mastering CDV, liquidity heatmaps, or volume profiles? DM me for personalized guidance.
Final Words:
Patience and discipline are key in current market conditions. Let’s trade smart and stay safe!
If you think this analysis helps you, please don't forget to boost and comment on this. These motivate me to share more insights with you!
I keep my charts clean and simple because I believe clarity leads to better decisions.
My approach is built on years of experience and a solid track record. I don’t claim to know it all, but I’m confident in my ability to spot high-probability setups.
If you would like to learn how to use the heatmap, cumulative volume delta and volume footprint techniques that I use below to determine very accurate demand regions, you can send me a private message. I help anyone who wants it completely free of charge.
My Previous Analysis (the list is long but I think it's kinda good : )
🎯 ZENUSDT.P: Patience & Profitability | %230 Reaction from the Sniper Entry
🐶 DOGEUSDT.P: Next Move
🎨 RENDERUSDT.P: Opportunity of the Month
💎 ETHUSDT.P: Where to Retrace
🟢 BNBUSDT.P: Potential Surge
📊 BTC Dominance: Reaction Zone
🌊 WAVESUSDT.P: Demand Zone Potential
🟣 UNIUSDT.P: Long-Term Trade
🔵 XRPUSDT.P: Entry Zones
🔗 LINKUSDT.P: Follow The River
📈 BTCUSDT.P: Two Key Demand Zones
🟩 POLUSDT: Bullish Momentum
🌟 PENDLEUSDT.P: Where Opportunity Meets Precision
🔥 BTCUSDT.P: Liquidation of Highly Leveraged Longs
🌊 SOLUSDT.P: SOL's Dip - Your Opportunity
🐸 1000PEPEUSDT.P: Prime Bounce Zone Unlocked
🚀 ETHUSDT.P: Set to Explode - Don't Miss This Game Changer
🤖 IQUSDT: Smart Plan
⚡️ PONDUSDT: A Trade Not Taken Is Better Than a Losing One
💼 STMXUSDT: 2 Buying Areas
🐢 TURBOUSDT: Buy Zones and Buyer Presence
🌍 ICPUSDT.P: Massive Upside Potential | Check the Trade Update For Seeing Results
🟠 IDEXUSDT: Spot Buy Area | %26 Profit if You Trade with MSB
📌 USUALUSDT: Buyers Are Active + %70 Profit in Total
🌟 FORTHUSDT: Sniper Entry +%26 Reaction
🐳 QKCUSDT: Sniper Entry +%57 Reaction
📊 BTC.D: Retest of Key Area Highly Likely
I stopped adding to the list because it's kinda tiring to add 5-10 charts in every move but you can check my profile and see that it goes on..

#CTSI(SPOT) entry range( 0.1100- 0.1450) T.(0.3649) SL(0.1014)BINANCE:CTSIUSDT
entry range ( 0.1100- 0.1450)
Target1 (0.2350) - Target2 (0.3080)- Target3(0.3649)
SL .1D close below (0.1014)
*** collect the coin slowly in the entry range ***
*** No FOMO - No Rush , it is a long journey ***
**** #Manta ,#OMNI, #DYM, #AI, #IO, #XAI , #ACE #NFP #RAD #WLD #ORDI #BLUR #SUI #Voxel #AEVO #VITE #APE #RDNT #FLUX #NMR #VANRY #TRB #HBAR #DGB #XEC #ERN #ALT #IO #ACA #HIVE #ASTR #ARDR #PIXEL #LTO #AERGO #SCRT #ATA #HOOK #FLOW #KSM #HFT #MINA #DATA #SC #JOE #RDNT #IQ #CFX #BICO #CTSI ****

CTSIUSDTCTSI ~ 1W
#CTSI Are you still interested in this coin? if yes, this is a support block that has been holding the price from going lower. maybe a small purchase here isn't so bad after all.

CTSIUSDTCTSI ~ 1W ✅
#CTSI Make purchases gradually in this demand zone, short term target of at least 20%+

Unveiling CTSI: The Hidden Gem with Incredible Trade Potential#CTSI/USDT #Analysis
Description
---------------------------------------------------------------
+ The price has reached its long-term support line, but a reversal has not yet been observed.
+ If the weekly candle closes above our support line, we can expect a possible reversal.
+ We will enter a new long trade after this weekly candle closes, but only if it closes above the support line.
---------------------------------------------------------------
VectorAlgo Trade Details
------------------------------
Entry Price: 0.1612 (after weekly candle close above support zone
Stop Loss: 0.12
------------------------------
Target 1: 0.2094
Target 2: 0.2742
Target 3: 0.3946
Target 4: 0.5870
Target 5: 0.9243
------------------------------
Timeframe: 1W
Capital Risk: 1-2% of trading amount
Leverage: 5-10x
---------------------------------------------------------------
Enhance, Trade, Grow
---------------------------------------------------------------
Feel free to share your thoughts and insights.
Don't forget to like and follow us for more trading ideas and discussions.
Best Regards,
VectorAlgo

CTSI LongEthereum layer 2 Cartesi lets developers build powerful dApps using familiar tools like Linux and Python, for improved scalability and security.
Currently around 250M market cap. And just above the weekly breakout.
Looking super Bullish.

#CTSI/USDT#Ctsi
The price has been moving in a descending triangle since April 2022
It adheres to its limits to a large extent, and we are now on the verge of breaking it higher
With upward momentum supporting this
And strong support areas
Current price 0.2272
First target 0.2855
Second target 0.3665
Third target 0.4545

CTSIUSDT Double BottomCTSIUSDT Technical analysis update
CTSI price recently exceeded the neckline of a double bottom pattern on the day chart, accompanied by high volume, after a 675 days of consolidation this TA analysis indicate the bullish move.
Regards
Hexa

CTSI showing a good investment opportunityHi Everyone;
today we have good risk to reward Investment opportunity
it is more than 85 times the risk and the chart is look very promising.
Good Luck Every one

CTSI ANALYSIS (1D)It looks like we have a diametric structure that we are in the middle of the F wave. What we expect is that the price will complete the F wave and reach the red box.
I also specified the invalidation level. Closing a 4-hour candle below this level will violate the analysis

CTSI Looking nice with good chartCTSI UPDATE: Another good chart that caught our attention this morning is CTSI…. CTSI is currently looking nice as it break daily trendline but facing daily resistance and it will be a big move if it breakout on daily TF…. I’m watching to see a clear flip in bullish before considering taking a nice long…. Keep in watch for nice gain
Follow for more market update

CTSI/USDT bullish scenario? 👀 🚀 CTSI Today analysis💎 Paradisers, turn your attention to CTSIUSDT as it showcases intriguing movements, potentially gearing up to revisit its support and set the stage for a bullish ascent.
💎 Historically, CTSI has been oscillating within a defined range, with the .1254 mark acting as a pivotal support. There's a strong likelihood that CTSI could embark on a bullish journey right from this point.
💎 However, should it breach this level, the next significant support to watch out for is at .1201. We're bullish about its potential to rally from this juncture.
💎 Additionally, with untouched supply zones overhead, we anticipate the price to challenge and possibly mitigate these levels in the upcoming period.
💎 Remember to employ prudent trading strategies and use proper stop-loss measures! Stay alert to market movements and look forward to more insight

CTSI IS BEARISH (4H TF)By checking the status of the chart, we can see that the CTSI is falling.
It has reached below the dynamic resistance line and mCHs are continuously observed in the internal structures (substructure).
CTSI is expected to drop the two announced targets.
No trade in digital currencies is without risk, so make sure to reduce the risk as much as possible before trading.
I specified the invalidation level, closing 2 four-hour candles above this level will violate the analysis

CTSI analysis (4H)Hi, dear traders. how are you ? Today we have a viewpoint to SELL/SHORT the CTSI symbol.
For risk management, please don't forget stop loss and capital management
When we reach the first target, save some profit and then change the stop to entry
Comment if you have any questions
Thank You

CTSI big dumpAfter big pump i think we will see big dump now ! Some reasons: We are under biggest support, price action set very vell , target is on biggest rez and on FIB and EMA (4h and 1d TF)
Give me like if you agree !

CTSI New UpdateHi, dear traders. how are you ? Today we have a viewpoint to BUY/SELL the CTSI symbol.
For risk management, please don't forget stop loss and capital management
When we reach the first target, save some profit and then change the stop to entry
Comment if you have any questions
Thank You

CTSI Looking bullish (Long)After a 5% correction of bitcoin and CTSI support holding, I expect the price to explode from here!
NFA

CTSIUSD targeting 0.5500 in two possible scenariosCartesi (CTSIUSD) emphatically broke above the 0.382 Fibonacci and is headed for the 0.5 Fibonacci (0.4000). With the 1D RSI massively overbought having almost hit 90.00 three days ago, it is possible to see a pull-back to the 0.236 Fib similar to September 2021. As long the 0.382 Fib holds, we may target the 0.618 Fib at 0.55000, otherwise we would welcome the 0.236 Fib pull-back for a better buy.
-------------------------------------------------------------------------------
** Please LIKE 👍, FOLLOW ✅, SHARE 🙌 and COMMENT ✍ if you enjoy this idea! Also share your ideas and charts in the comments section below! **
-------------------------------------------------------------------------------
💸💸💸💸💸💸
👇 👇 👇 👇 👇 👇
