CTSI/USDT TRADE SETUP!Hello everyone, if you like the idea, do not forget to support with a like and follow.
Welcome to this CTSI/USDT trade setup. CTSI looks promising here. Breaking out of the inverse head and shoulder pattern. Buy now and add more in dips.
Entry range:- $0.77-$0.8
Target1:- $0.84
Target2:- $0.88
Target3:- $0.94
Target4:- $0.98
SL:- $0.72
Lev:- 5x
If you like this idea then do support it with like and follow.
Also, share your views in the comment section.
This isn't financial advice. DYOR before investing.
CTSIUSDT

CTSI/USDT TRADE SETUP!Hello everyone, if you like the idea, do not forget to support with a like and follow.
Welcome to this CTSI/USDT trade setup. CTSI looks good here. Already broke out and retested in a 2hr time frame. Buy some now and add more in dips.
Entry range:- $0.96-$1.01
Target1:- $1.12
Target2:- $1.26
Target3:- $1.44
Target4:- $1.72
SL:- $0.89
If you like this idea then do support it with like and follow.
Also, share your views in the comment section.
This isn't financial advice. DYOR before investing.
Thank You!

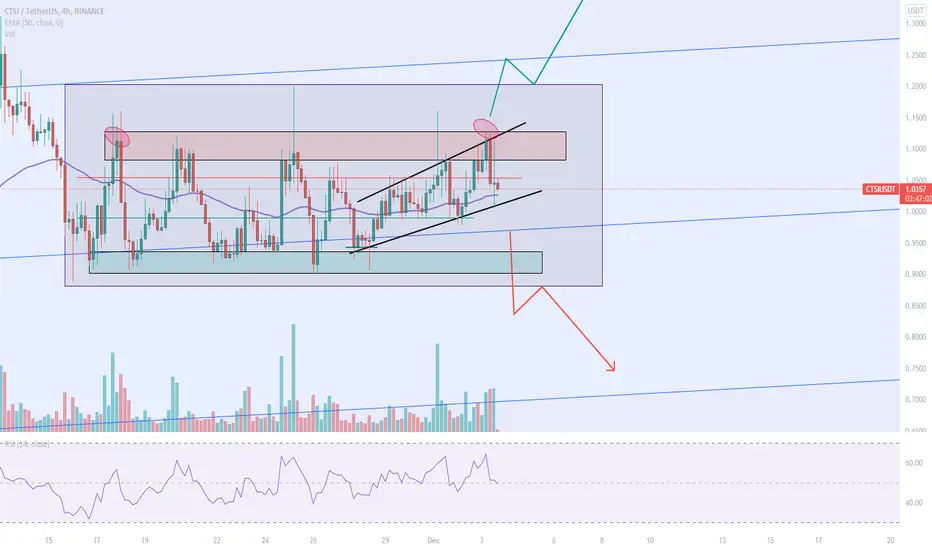
CTSIUSDT Can a price explosion happen?KUCOIN:CTSIUSDT
Hello everyone! This is my first idea that I'm posting, and I want to quickly talk about CTSI and my opinion on it.
CTSI has been in a sideways market on the 4/hr chart. Right now, CTSI has hit a resistance level, and a double top pattern has also occurred. Price did react to this with a large bear candle and is still continuing for the time being. Because this is a sideways market, we're waiting for which direction the market will explode. If it goes over the box, it will go into an uptrend. If it goes under the box, price will go into a downtrend, make sure to also wait for a confirmation. (We may find a reversal at around the 1.5-1.7 mark too.)
S/R LEVELS!
Support Level is around 0.009 - 0.9363
Resistance level is around 1.0810 - 1.278
Note: I'm not a financial advisor, please do your own research, and don't invest more than you are willing to lose!
Thanks for reading this idea! If you have ANY feedback, please tell me in the comments below so I can improve my future ideas. Thanks!
CTSI/USDTesting/tracking elliot wave theory. Please do not trade off idea without S/L. Not financial advice.

+30% MOYEN TERMEGOOGLE TRAD
A bullish momentum in sight on this asset.
In terms of momentum at the start of the uptrend, RSI confirms support in the neutral zone.
Resistance levels 0.618 tightened the hardest to cross however the November 25 candle has already come to test it which is a good bullish sign. In view of the volumes, once this resistance has been crossed, the next obstacle tightened the 0.786, which is a good performance for the medium term.
Objective levels I would be advised to put a stop around 1.2980 to recover some profit, then put towards 1.3880 to completely close the position.
WARNING ! , this analysis concerns an altcoin, the observed asset is very dependent on btc, eth ... and other large crypto so we must remain vigilant and measure if the risks are worth it. This is my analysis is based on my observation I am providing it to you for information only.
Leave me a comment with your opinion if you wish I would be delighted to speak with you.
FRENCH
Un élan haussier en vue sur cette asset.
En terme de momentum début de le tendance haussière, RSI confirmation du support en zone neutre.
Niveaux résistance la 0.618 serra la plus dur à franchir cependant la bougie du 25 novembre est déjà venu la tester ce qui est un bon signe haussier. Au vu des volumes une fois cette résistance franchis le prochain obstacle serrais la 0.786, qui est une belle performance pour du moyen terme.
Niveaux objectifs je serais d’avis de mettre un stop vers les 1.2980 pour ainsi récupérer un part de bénéfice, ensuite mettre vers les 1.3880 pour clôturer complétement la position.
ATTENTION ! , cette analyse porte sur un altcoin, l’asset observé est très dépendant du btc,eth … et autres grosse crypto donc il faut resté vigilent et mesurer si les risques valent le coup. Ceci est mon analyse est porte sur mon observation je vous la fournis à simple titre indicatif.
Laisser moi un commentaire avec votre avis si vous le souhaiter je serais ravi de m’entretenir avec vous.


MY VIEW ON CTSI/USDT FUTURE PRICE ACTIONCTSI is currently in a range, which I believe, is an accumulation phase. I believe, price will soon break its previous resistance, retest (which I believe, will the mitigation of a mitigation or propulsion block) and go up to take the external range liquidity on 1.7295
If price is able to break through this resistance, its going to be a low resistance liquidity run and that's an advantage cause it will be easier for price to move faster!
This is gonna be one hell of a crazy moonshot if my prediction is correct.... It will produce a 50% move or even more!
Disclaimer: This is just my perspective.... Not a signal. Just my point of view!

CtsıusdtCartesi (CTSI) is a utility token that powers the Cartesi network, which aims to solve blockchain scalability and high fees using a technology called Optimistic Rollups. CTSI can be used for staking and fees for processing data on the network.

CTSI - Back to ATH's!CTSI has been making nice bounces off the ascending trendline and has been creating bullish corrections.
We recently saw a triple bottom and waiting for a breakout. On the 4H timeframe, watch for a strong move up.
If price breaks below the ascending trendline and the triple bottom, the bullish outlooks will invalidated.
4H timeframe:

CTSIUSDT - BULLISH SIGNAL UPDATE!!As you all know, CTSI is not performing well from last 2 months and according to the Chart patterns, Decending Bullish Flag is formed, Breakout formation and also indicators giving bullish signal.
Short term Trade, DYOR Before taking trade, as i'm not responsible for your loss.
RISK FACTORS:
Market/ BTC CRASH
Happy Trading :)
Good Luck!
If you like my idea, please support:
Binance Smart Chain ( BSC ): 0x69Ea86D0f6B762fC36A322b0C833D2bd04534b3d

ctsibtcCTSI BTC pair under huge triangle that I put an alarm when price catch that downtrend resistance that if break that level I will buy
BINANCE:CTSIBTC

CTSIUSDT - Huge Profit On WeeklyCTSIUSDT On Weekly/TF has a Huge Movement.
We have a very good upward channel in the chart.
BUT :
We haven't any confirmation on the chart, still.
We will wait to see this confirmation then we join this huge profit.
You can put it on your watchlist, also.
We must also consider the bitcoin movement.

CTSI great project but looks manipulated. This project is one of the few good ones on ETH if you dont know what is it about read it. if you dont care well straight to the point this chart keeps repeating the same pattern over and over the arrows show when and I just copied pasted the bars since its going to do the same. this is a good entry around 0.89-1.00 for a couple of week should be an easy 25%-%50% profit.

CTSI/USDT 4H timeframeIn the 4H time frame, we will probably see a positive reaction to the level of 0.618 Fibonacci.

CTSI long opportunityCartesi has seen a nice run up and is now working on its retracement.
The green support zone could be tested once again and this is, in my opinion, the best area to place your longs. However, given the state of the market (as I've said time and time again) I would not be surprised to see price rally up once again without it reaching all the way down to that support zone.
As we can see on the chart:
- Breakout of the channel; retest looks to be in the books
- EMA's still curling away from each other
- RSI coming back to the midrange
- Price reaching the golden pocket on the FIB
Set my stop loss just inside the channel and below the golden pocket to give a nice 4R:R.
If you want to take a bigger risk, you could also place it at $1.06 as that's the most recent high of the channel.
If we fail to move up, I'll be looking for a new long in the green support zone.
How do you feel about this setup?

CTSI Moon $5 Target EOY PREDICTION Charted this out couple weeks ago and it played out the wedge as I assumed it would. HOLDING THE .786 FIB will make $2 by end of month possible. If not I see CTSI breaking down too the .5 FIB which needs to be held if this coin will be anywhere in this bull run. The wedge of this coin on the weekly is insane so now the direction this coin now realize on the upcoming news announcement and catalysis.
TARGET 1: $2.5
TARGET 2: $3
Target 3: $4
Target 4: 5.4
Target 5: 6.25

CTSI Mid-Term 1100% Growth potentialYou may notice that CTSI has moved within a very distinct channel for the last year or so. By drawing Fibonacci channels, we can identify a few strong support/resistance levels.
I drew an entry zone which may be your only chance of getting in early before a potential run towards a 10 USDT valuation. Based on these channels, I'm confident in saying that CTSI is still a very early buy. However, I suggest waiting until CTSI hits its newly-formed support.
I also drew a blue channel representing CTSI's short-term movement. As you can see, it has had some difficulty breaking through that mid-range resistance.
What do you think of this analysis? Let me know!

CTSIUSDT - Come on baby ... Be quick and pumpI have been holding CTSI for a long time and I am tired of not moving enough or going up and down again.
We are close to the Fibonacci Time Zone level and we are involved with level 2 of the Fibonacci channel resistance.
After the Breaking and crossing of these two levels and after the breaking of the triangle trend line and the RSI , I hope for a strong pump.
Hoping for financial success for all investors.
Follow me on TRADINGVIEW , if you don't want to miss my next analysis or signals.
It's not financial advice.
Dont Forget, always make your own research before to trade my ideas!
Open to your questions or suggestions(Looking for investors!).


CTSI/USDT TRADE SETUP! 30-40% PROFIT EXPECTED!Hello everyone, if you like the idea, do not forget to support with a like and follow.
Welcome to this CTSI trade setup. CTSI looks good here. It breaks out from the big triangle pattern and currently retesting it. So I'm buying some here and adding more in dips.
Entry range:- $0.76-$0.79
Target1:- $0.8368
Target2:- $0.8864
Target3:- $0.9462
Target4:- $1.02
SL:- $0.7172
If you like this idea then do support it with like and follow.
Also, share your views in the comment section.
This isn't financial advice. DYOR before investing.
Thank You!


CTSI/USDT -- Poised for a runCTSI looks poised for a bullish run. It's slightly below the bottom median line. Once it breaks above and heads for the center median line - 2x looks possible.
