$TWTR Cup & Handle! LONG call optionsTwitter stock forming a cup and handle. Took the march 1st 32.00 call options today for 0.50 each. My target is 33.75 and stop is 30.50.
Cup-handle

inverse cup and handleInverse cup and handle forming on daily chart, and we can see Williams Alligator short signal


Tron's the most bullish lookin chart in crypto at the moment.The 1 day golden cross is inevitable the bullish breakout of the bull flag seems inevitable too which should then also make the cup and handle breakout occur as well. A perfect triad of patterns all combining with a daily stoch rsi that has lots of room to fly make this an easy long. Golden cross should occur in the next 3 and a half hours. If it hits the cup and handle breakout target it can almost double it's price but once again a reminder that this is not financial advice ;) thanks for reading!

Gold Cup and Handle Guld will rise to resistens levels and create the handle. After that it's 50/50 if we will se the bull or the bear. Sell if the cup line gets broken.

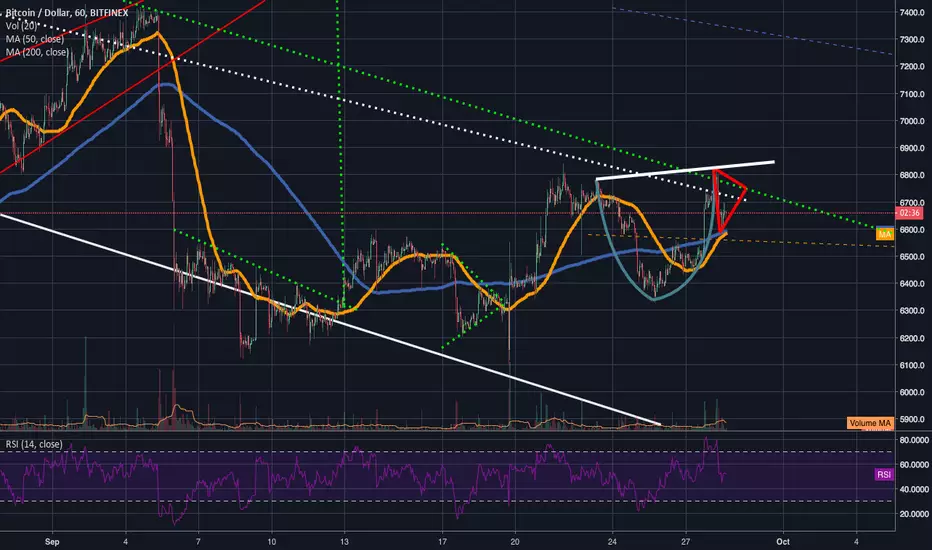
Slight chance @ both a C&H on 1hr btc chart & an inv h&s patternKeeping this idea neutral now because although both patterns are in play I don't have that high of confidence either will actually get triggered...the main one I'm gonna show first is this Cup & handle pattern that is forming on the 1 hr chart. We can see that the 1hr 50ma and 200ma are very close to completing a golden cross here and that the 200ma on the 1hr chart is so far holding support fairly well....the 200ma on the 1hr chart and the 200ma on the 4hr chart are sort of overlapping right now and acting as a kind of double reinforced support and the 4hr chart is also on the brink of a golden cross as well. If the 4hr charts 200ma can maintain support as well as the 50ma when it comes up above the 200ma if it maintains support I think these 2 patterns triggering can very much so become a reality but for now I'm not that confident in them only wanted to mention that they were worth keeping an eye on....below this in a follow up update I will post the inverted head and shoulder I decided to post it separately so you can more clearly see the cup and handle pattern but essentially the cup is the 2nd shoulder of the inv head and shoulder pattern.
Inverted Cup & HandleToday is the day of inverted cup & handles, it's visible on many coin's charts.
For BTC target can be 6560.

A (almost) perfect Inverted Cup and HandleTarget can be 7000 if it not go lower.
It broke down exactly at the time of making it.

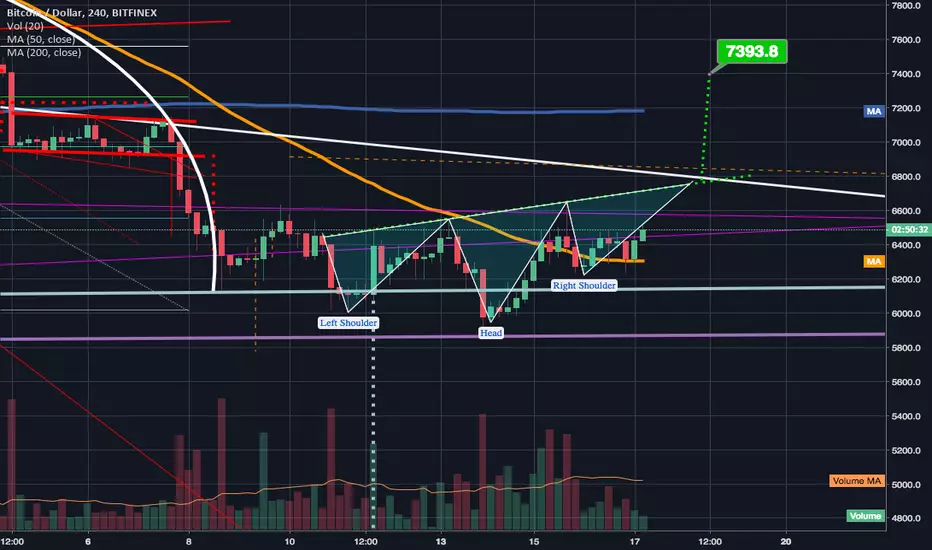
Potential Inverted Head & Shoulder Pattern on 4hr chartAfter seeing a nice fakeout on the daily of the inverted cup and handle pattern we are now seeing the 4hr chart form both a higher high and at least for now what appears like it will be a follow up higher low...if so the odds are favorable of following that up with another higher high and in doing so very likely we could trigger this currently developing inverted head and shoulder pattern. Though the 4hr chart is looking bullish we must still keep in mind that on the 1 day chart we have a giant bear flag and an inverted c up and handle to tend with...one of these 2 paths will be chosen either the bullish 4hr chart scenario will p;ay out or the bearish 1 day chart scenario. So be ready for either this idea for these reasons will be listed as neutral.
Amlook at the weekly chart.We can see last after being knocked down by the 50ma on the 1 week chart that last week's candle has closed back inside the descending triangle pattern invalidating the previous week's breakout...we also seem to have formed a nice handle for a 1 week chart cup and handle pattern however we don't want the handle to dip much lower than it already has or we will be less and less likely to trigger a cup and handle. Look for this week's candle to maintain the 1 day chart's 50ma as support. If it can then we should hopefully be able to break right back upwards out of the descending triangle pattern and hopefully maintain the breakout this next time. If we fall under the 1 day 50ma and it flips to resistance we could prolong our fall to 6.5k or even 6-6.1k but I'm trying to remain optimistic for now.

Correction continues; potential C&H + 3 possible support zones3 lines of potential support for this fall I'm seeing our number 1 at 7413 which is top trendline of the big descending triangle pattern / adam and eve neckline we broke up from # 2 is the 4hr 200ma at 7060-7080 #3 is the 1 day charts 50ma at $6853..to have a chance at forming a higher low on the day chart, triggering the current cup and handle unfolding and the 1 day golden cross one of these will likely have to remain support. If we can remain above the 1 day 50 MA then this will just be a correction that will inevitably resume the uptrend and the golden cross should occur hopefully sooner than originally planned, coupled with some positive ETF news to help us break out of this handle, break above the neckline and potentially trigger the cup!however a few closes under the 1 day 50ma and then we could be looking at an impending lower low on the 1 day chart. In the short term I'm short...but long in the longterm. Good luck and thnaks for reading! **not financial advice**.


BTC anything is possibleBTC anything is possible
As we have seen in the past week BTC can acheive some amazing moves
Just thought i would see your thoughts on this possibility.
CUP N HANDLE FORMING?

BTC may be forming a cup and handle.Just my opinion, but with both the 4hr charts rsi and stochrsi well exhausted and well into the overbought zone and the 1 day chart's indicators now just reaching overbought conditions, I don't think we will be able to sustain an immediate breakout of the inverted head and shoulder pattern and a small correction is due to reset these indicator levels before a breakout can be sustained. at the same time we would like to see the price reach $6850 or so before any type of correction or retracement to establish a higher high on the 1 day chart and keep the ball in the bulls court. We can also see a very cup like price pattern has formed on this right shoulder. Also keep in mind that cme futures are set to expire on July 27th. All things considered my guess is that one of the 4hr candles that occur today will hit the $6850 region to complete the rimline of this cup pattern and then for the next 10 days or so we will see it form a handle until those futures expire at which point we will break above the cups rimline, the neckline of the inverse head and shoulder and the symmetrical triangle pattern we are in. Perhaps it will be Q3 which is the bullish one this year.


We broke below the rimline of an inverted cup and handle.Something to be aware of. I have mentioned a potential inverted cup and handle awhile back maybe 3-5 ideas back...well with the latest drops we broke under that inv c&h's rimline which triggered a steeper fall. This is an incredibly deep cup and if it were to reach 100% of its projected target it could send us all the way to 4-.4.1k We have seen many normal cup and handles recently that have not reached 100% of their target however but we have also seen ones for example tron who have far exceeded their breakout target. So it's very much worth being aware of. At the same time there is a slight chance we could see a triple bottom form with February and April's lows and go skyrocketing back upward...or even just a double bottom with April's low. Definitely a difficult time to decide to be bull or bear...so in these instances it's best to follow the higher high/higher low principle as well as the lower low/lower high. By going by that principle alone it's not the wisest to enter right now...If you are hoping to potentially catch the double or triple bottom it may not be a bad idea to enter with a tight stop loss though. However it's best if you make your own decisions because this is not meant to be taken as financial advice. Good luck in whatever you choose and may the probabilities be on your side.


looking to form a higher low..potential h&s in playThe recent dip back to the 4hour 50ma has us looking for a bounce and hopefully forming another higher low to continue the series of higher lows/higher highs. However, it sent a bear wick under the 50ma before bouncing back upward and that wick dropped down to the exact level it would need to complete the head of a new potential head and shoulder pattern. Because of this it is imperative that on the next leg up we form another higher high otherwise the odds of forming the right shoulder of this potential head and shoulder pattern will be of a very high probability. Furthermore if we were to trigger that head and shoulder pattern there is a much larger inverted cup and handle pattern that could potentially be triggered shortly afterwards. Seeing a higher high after this higher low forms is very important, and if not at least an additional higher low or 2 until we reach that higher high. Hopefully this is what occurs...the inverted head and shoulder pattern we just broke above failed to reach its target breakout though so maybe the same would be true with a regular head and shoulder pattern as well. Stay cautious and vigilant and prepared for either outcome and you should be fine. I'm still optimistic of a bull run, but ready for the opposite.

DNR Long - Cup n HandleBoth A and B plays require volume to wane as price declines
Plan A - Play the handle tail into retest.
Plan B - Play the fully formed Cup n Handle validated retest
Buy at A is if price begins to rest at 3.60 and volume remains low. Look to sell at B or for a 15-20% swing up.
Buy at B if high volume breakout of resistance. Hold time period is 6 months+ at this stage.

Cup N' Handle almost complete!Hey TradingView,
We are the Cryptono Vikings, a free Discord community where you can come to learn technical analysis for free at your own speed! Come join us discord.gg
Today we bring you the Cup N' Handle. This pattern I found someone else charted but I couldn't find it again and I figured it would be a good lesson to try charting it myself and make my own targets etc.
So I drew my top resistance line and measured the bottom to the top of the cup, to see if the handle is less than 50% and it is just shy of it which means it is valid.
Next step was to take that distance and add it on top of the resistance line to get your target.
My suspicion is that either we complete this pattern slightly before or right on main net launch, and then we go skyward :)
My Target:
1800 sats
Oddly enough, I have seen others project 1800 sats, and that is just the beginning :)
This idea is for reference and educational purposes.
Cup N' Handle Pattern: www.investopedia.com
Trade safe my friends :)

Steem possible cup & handle formationHello all, after 2 weeks of holidays in back in the crypto world!
Steem is showing a possible cup&handle formation, An healthy retracement followed the strong uptrend happened in during April, in this scenario the impulsive 5 waves and ABC correction are clearly visible.
On the daily chart supports match well with the fibonacci retracement, the price actually sit on a 4hr support and seems to consolidate but could briefly touch the next stronger support around 3500sat, could also be the end of C leg and the 0.618fib
On the H4 timeline the falling wedge is squeezing but is also visible a small hidden bearish RSI divergence, this could shortly lead right in the daily support I mentioned before.
Next hours should tell us more information, watch out the price for a possible reversal signal!

Ethereum potentially reach neckline of its cup and handle.Keep in mind to the left of the cups left side of its rim is a higher candle wick which could potentially be the real rim of the cup and the cup could be deeper and have yet to have formed its rim...We will know whether or not the current neckline is the real neckline of ethereum's cup when we see large bull volume after we break the neckline within the first 3 consecutive 4hr candle closes above it. If not we have most likely not formed our cup yet and have will thus more dipping to so

Vechain c&h has triggered; QLINK & GAS heading towards rimline.Yet another installment in the neverending cup and handles of the altcoin market. The main chart is Vechain I will post gas and qlink snapshots in the update section.
