$BIMI has a cup formation in the making, maybe scallop :).We have this amazing play here in the explosive industry. Company well-positioned to profit in this chaos, masks are in huge demand. With a tiny float of only 3 million shares and insiders holding 78% of the company, :) ... We have those people on board to use a crisis to propel this stuck into unrealistic heights. I decided to accumulate now and add much more when the downtrend shown on the chart will be broken. It is not hard to predict that their ER will that is about to come out will be great.
CUP

usdchfcup and handle again i believe. its the second cup and handle im trading. it was wonderful but the market is returning back again and again and hitting sl in profits so ill recommend taking profits and find another trade. chf is strong today i hope this will give money. please do your analysis before entering.i can be wrong.
thanks

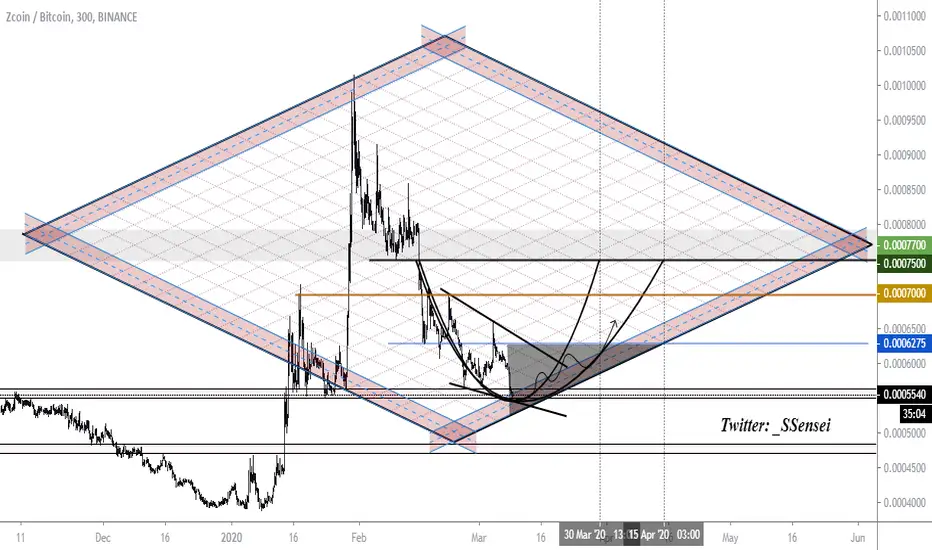
XZCBTC 5HZCoin is at the bottom, on the support line. I think the return will be nice.. Break a leg!
Kin Pump Coin Formed "Cup" - Target + 200%Kin pump coin may be formed "Cup" - the target for a cup + 200%. If there is a breakdown of the downtrend, the goal is much higher.
This pamp coin is often a pamp coin, including in the downtrend. Past pumps from +90 to + 330%. The first serious resistance, past support which has now become resistance from the current price + 420%.
If we assume that the “Cup” figure (saucer, rounded bottom) will continue to be drawn, then we are now in the 2nd phase of the figure formation, and these are the lowest prices.
It is also worth noting that if the price breaks the base of the “Cup” and fixes below it, then you should forget about the further formation of the cup. It is advisable to place a stop order under the base of the "Cup".
With current prices, stop has the minimum value, therefore the risk is minimal, a few percent, and profit from +200 to + 400%,
The ratio of risk to profit in a wonderful ratio.
_______________________________________
Sales Purpose:
According to the figure "Cup" + 200%
On the first strong resistance + 400%
Stop - Loss 3-5% (depending on your strategy)
_____________________________________________
The stages of the formation of the figure are “Cup” (Saucer, round bottom).
The Saucer figure consists of the following steps:
1) The descent of the price is the first phase of the figure . Price fall trend with a gradual slowdown. In the classical case, it should be a smooth arc, but in practice its shape can be flat or contain, on the contrary, correction minima and maxima. The main condition in this case is the gradually decelerating pace of price reduction.
2) The bottom is the lowest point of prices. It is the geometric center of the figure. It should be located on a gentle bottom (smooth bottom, without peaks). Although sometimes such a formation as the "Thorn" down or closed squeezes comes across at the bottom. The main thing is that these local formations do not violate the overall picture of the figure and movement in the global. If the lower point of the price forms the so-called platform on the chart, then the trading volumes gradually decrease, and at the moment of the price jump up sharply increase. Another surge in prices may be a signal to buy if the maximum of current prices is higher than the previous maximum.
3) Ascent of the price - after the minimum follows the ascent, which should ideally be symmetrical to the descent, and should last as long as the first phase (the descent of the price). There is a tendency to increase prices with a gradual acceleration.
4) The intersection of the resistance formed by the upper boundary of the whole figure (passes through the maximum point of the figure at the beginning of the period of its formation) is an additional confirmation of the rounded bottom and the final phase of the formation of the figure. After breaking through and fixing the price, the resistance level turns into a support level. When crossing the resistance, the volume rises as a rule.


IDXX Labs Settings Up For a Cup-Handle BreakoutNASDAQ:IDXX is forming a cup and handle breakout pattern. What's interesting is the cup's highs were long-term resistance at all-time-highs. So, a breakout leaves no resistance in the way of a rally.
I added a trend-based Fibonacci extension to try and get a price target, and it printed between $300-$307.
For trade updates, @DoozyTrader on Twitter.

EURCAD. Cup and Handle Pattern.Hi subscribers.
This chart shows the cap and handle pattern.
This means that the price must rise!
And its target will be the mark 1.43629.
Keep an eye on the price,
because the price can break the call of tormentation and grow even more!
If you liked this idea, please like and subscribe to my profile.
This idea does not provide the financial advice.

Cup & Handle Breakout on $TSLA after Gap fill today. $1,050 TGTHuge Mover and this cup from recent record highs had shorts expecting a big crash, but buyers have come in and institutions are buying as Analysts are finally catching on and raising their price targets. The crashed hard this morning with everything else buy buyers came in strong at the gap fill at $860 forming a bullish hammer reversal on the Daily chart. MEASURED MOVE OF THE BREAKOUT HAS $1,050 TARGET.
News broke right at close that the injunction that had been brought against their Giga 4 Berlin had been over ruled and that Tesla could Continue the build out... i'm always amazed how news like this breaks at the exact opportune moment.
Stochastic RSI also got to oversold and crossed bullish into the close.
Even if markets don't recover tomorrow, i still think we see a gap and go on the open squeezing these shorts to the point of the most recent high of $944.78, and then right after that is the all time high at $968.99. Past that and we could see $1,000 test very quickly, as everyone is expecting it to test $1,000 before taking a breather.


BTC (Y20.P2.E5).Macro.Cup and Handle time?You decide!!
Ribbon is the 10 and 20 EMA on the daily. One can imagine this moving into the target buy zone and hence still bullish.
Please don't forget to give me a tick\like, as I would appreciate it.
Regards,
S.Sari
(for my reference > Master.copy)

BAT (Y20.P2.E1).Macro.V or CupH. PotentialHi All,
Its another coin and area to pay attention too.
MACD looks good on the daily with convergence, unlike many other coins.
Note the V or W formation, very bullish or potential cup and handle.
It would not surprise me if it goes all the way up.
Inverted H and S to be completed. A 0.236 fib pullback potentially with BTC looking to move sideways for a short time.
Supported by potential BTC Dominance to keep dropping in the short term. Note the Bullish Div . on the 4 HRLY.
Please don't forget to give me a tick\like, as I would appreciate it.
Regards,
S.Sari
(for my reference > Master.Macro)

Bitcoin OverviewHello, if we remember, Bitcoin started strong attacks by reacting strongly to a 30-week downtrend and we have to look 25 weeks to understand Blockhain Data Relative Change on falling point :
Currently, the Buy Signal continues on the weekly chart.
But we are a few millimeters away from the resistance (9335.7) :
If we look at the Terminal status in this 25 Weeks period:
Blockchain data change seem strong.
There is only a decrease in the Transaction Volume.
However, it should not be ignored that this data is that is subject to great changes even during the day.
Apart from this, it seems that some altcoins are trading with very discount.
In the continuation of the positive scenario, those who are over-discounted have the chance to rise more than bitcoin.
(If they have no subjective problems)
It should not be forgotten that they will take a share in the continuation of the positive scenario.
So let's give importance to Minor Resistances in the Bitcoin subj.
Conclusion
It is very important that the weekly closing is above the resistance and the Buy signal does not change for Long.
The bulls are strong now.
Therefore, it can only be considered at a close under support.
By the way,
Our Altcoin trades continue.
I'm attaching them on Related Ideas , if you want to look at them too . (Litecoin ended and waiting for Ripple Weekly Close too.)
Regards and have a nice day!


LTCUSD - H4 - BUY TIMELTCUSD is creating a CUP Candels Pattern.
Wait for correction wave and reverse candels, then we can get Long Position.
Good Luck

Bitcoin - H4 - SELL & BUYIt's going to create CUP - CANDELS pattern.
Wait to price reach to bound of channel and then sell it.
After that wait to price get close down bound of channel and then get long position.

Massive C&H pattern in weekly chart?Hi traders and crypto friends, it´s BohemianCrypto,
I´ve found out very interesting C&H pattern in weekly chart. Before halving I expect uptrend move in ichimoku cloud between lines, but atleast to 10k. Then I expect fall to present price till autumn.. What´s next we will see..
Let me know what do you think about my idea, I´m new in cryptos.

IOSTBTC 4HIOST may Breakout test and can force resistance with the Bearish Bat Pattern - H&S, i think it's bullish soon... Break a leg&Good luck!

Frontier goes to the top againAt the moment, I think that there is a high probability of reaching the $ 1 mark again, but further growth of the stock can also be expected


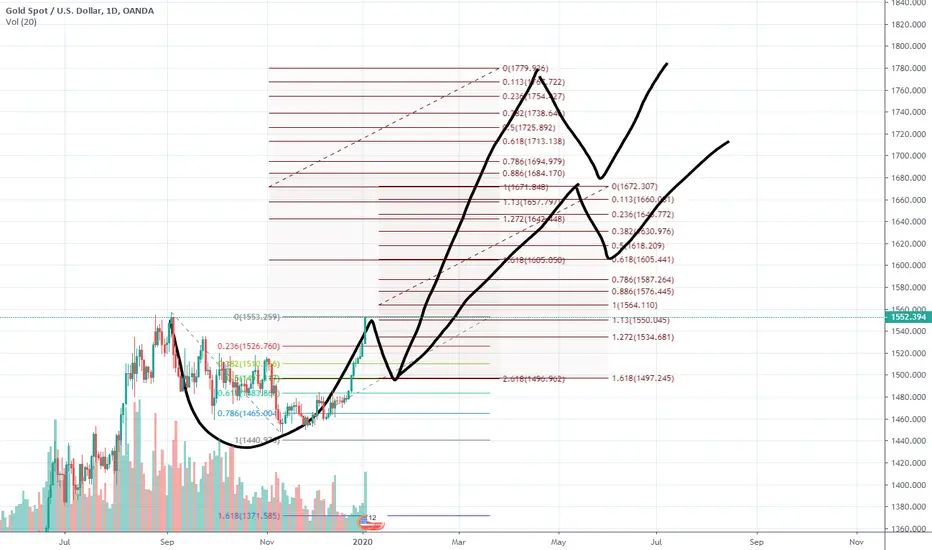
Iran issue really game changer... possible to see 1700 need to see how deep the correction of wave 2 (or the handle of cup pattern) from 0.382 to 0.786
usually, we won't see 0.618 (because this is big pattern and we are inside super bullish trend)
or 0.786 (dunno why i see this fib from lot of wave 1...)
big bet from bulls would be bounce from 0.382 and 0.5
more people would switch from 1600 to 1700 soon, if gold bounce from 0.382 and 0.5 fib retracement