CUP

huge potential on chainlink cup & handle if breakout triggersKeep an eye on this one people...chainlink is going back down to retest the rimline of its cup and handle pattern if it solidifies support here and we see some nice bull volume to go with it then it will be a big buy for sure. Currently it could still be a fakeout but probability is currently favoring a validated breakout. Fundamentally chainlink has a lot of good things going for it. Their oracle system will likely be the standard in crypto and I'm pretty sure coinbase plans to list it soon as well. If it does trigger this breakout the price will likely double.


Tron's the most bullish lookin chart in crypto at the moment.The 1 day golden cross is inevitable the bullish breakout of the bull flag seems inevitable too which should then also make the cup and handle breakout occur as well. A perfect triad of patterns all combining with a daily stoch rsi that has lots of room to fly make this an easy long. Golden cross should occur in the next 3 and a half hours. If it hits the cup and handle breakout target it can almost double it's price but once again a reminder that this is not financial advice ;) thanks for reading!

Coin 2 Watch: Tron / Golden Cross, Cup & Handle, and BullflagDespite the current bearish outlook on bitcoin we can see that tron has a lot of exciting things currently going for it on the 1 day chart on binance. It has completed a cup and is now currently working on the handle which happens to be inside a very long bull flag. We can also see what appears to be an inevitable golden cross about to occur on the tronbtc pair which should be sustainable when you factor in the other bullish patterns that are about to trigger along side that golden cross..would not surprise me one bit to see tron stay resilient and even somewhat in the green during btcs next bear move. We can see the daily stochrsi has plenty of room to go up as well. Fundamentally this could be caused by a few different factors but I think the 2 biggest are that it was added as a pair with xrp on binance and also trx was named the first binance gold label project coin. There's likely other big developments recently too but I haven't had time to dig any deeper into the fundamental side of tron. Anyways I expect it to do very well in the following weeks if this golden cross occurs and the cup and handle triggers so while this is not financial advice I do recommend you keep an eye on it and make your own decisions on whether or not to grab any for yourself. Thanks for reading.

XRPBTC breaking above cup and handle rimline!XRP just got a sudden break to the upside both on the xrpbtc chart(shown here) and the xrpusd chart. Here on the xrpbtc chart however we have taken the price action above the rimline of a cup and handle pattern it has been in and if the daily candle can close above this line we have a chance to trigger the breakout on this pattern o this Christmas Day candle and what a beautiful Christmas gift that would be because a breakout of this cup and handle would lead to a massive upside and plenty of gains against btc. The handle of the cup and handle is actually a smaller cup and handle itself so we will watch for that one to trigger first and if it does we wll have fantastic probability that the bigger one will also trigger it's breakout. Ethereum has been having a sizable bull surge recently too and has almost gotten back up to taking back the number 2 spot on coinmarketcap but now it looks like XRP is reaady to defend its position...seems like its currently a great time to be in both coins...although my lions share is behind xrp between the 2. Thanks for reading *not financial advice*

A Cup and handle appears on xrpbtc!the price action has found resistance on a trendline that fits the angle of the other 2 previous tops and creates a valid rimline for a cup and handle with some very notable upside....should this cup and handle trigger it would not only take us to the price target for the previous inverted head and shoulder breakout that we've been patiently waiting to reach but it would take us up past the neckline of an even bigger inverted head and shoulder pattern that would trigger a serious breakout...so lets hope this cup and handle pattern is indeed valid...we are currently finding strong resistance there but we will soon have the momentum of the orange 40 ma line coming up to meet its resistance which will likely result in it pushing the price up and above the cup and handle rimline. Hopefully this is how it plays out. Thanks for reading! *not financial advice*

LINKBTC CHAINLINK forming Cup and Handle on weeklyChainlink looking very nice forming the cup and handle (yellow line).
If the technical pattern continues we could see a massive rally soon
Short term target: 0.00006900 (7%)
Long term target: 0.00009345 (50% , recent November highs)
Very Bullish target: test above 0.00010000

BCHSV/BTC ADAM EVE + CUP N HANDLE?The patterns are not textbook exactly but they certainly have the general shape. The handle is a little long for my liking and the A&E doesn't make a perfect double bottom as the second low is higher.

WTCBTC - BinanceDon't hurry to buy! Wait till the price crosses up the green zone. If price touches the second target, there will be cup pattern.

Gold Cup and Handle Guld will rise to resistens levels and create the handle. After that it's 50/50 if we will se the bull or the bear. Sell if the cup line gets broken.

Speculative Fractals estimate btc's next 3 ATH prices + datesthis is completely speculative based on the rising wedge we may currently be in...if that rising wedge maintains it's validity then we have here the next 3-4 potentially ath pricepoint and roughly what month and year we should reach them. What I'm seeing currently potentially is with each new peak and crash we appear to be cutting the size of things in half. The last peak to bottom is roughly half the size of the one before it..if we continue this fractal pattern we should form another cup and handle that is half as wide as the last one we triggered to get to our current ath, which also means we should reach each subsequent new ATH in roughly half the time it took for the one right before it. If this fractal holds, then the 3 upcoming speculative ATHs listed here on the chart as well as their month and year should hold a fairly probable chance of playing out. Of course I am not a financial advisor and unlike most of my TA this one is still highly speculative but i was a fun thought that I wanted to share just in case it were to actually play out this way. Thanks for reading.

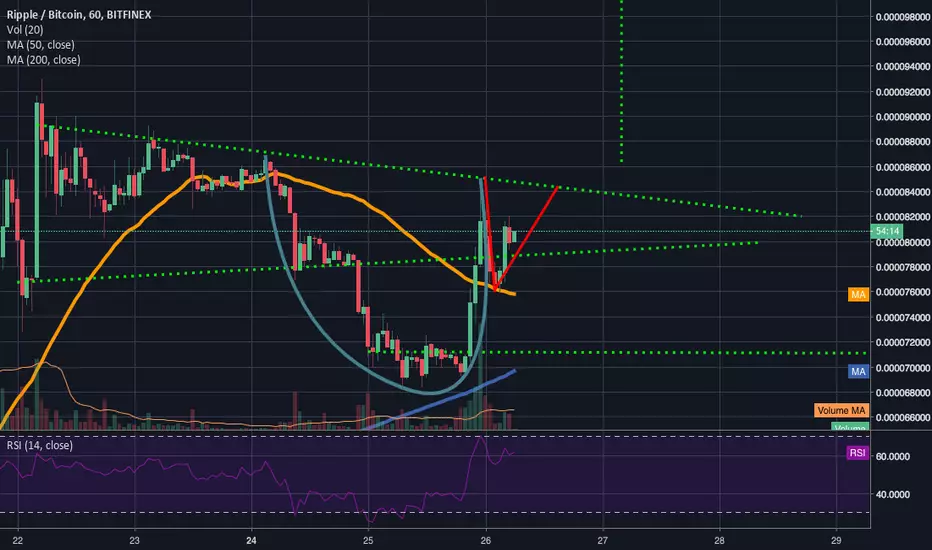
XRP 4hr cup and handle pattern overlapping 1day bull pennantShow here is the 1 day chart bull pennant. I will post the 4hr chart below this to get a better look at the cup and handle. The top trendline of the bull pennant is overlapping with the rimline of the cup and handle pattern...which is currently causing double reinforced resistance...I believe however by the apex of this 1 day bull pennant(next 1 day candle) that we will be able to flip that resistance to double reinforced support and continue our breakout upward. We should know by the next 1 day candle....of course always wise to be prepared for the exact opposite outcome as well.

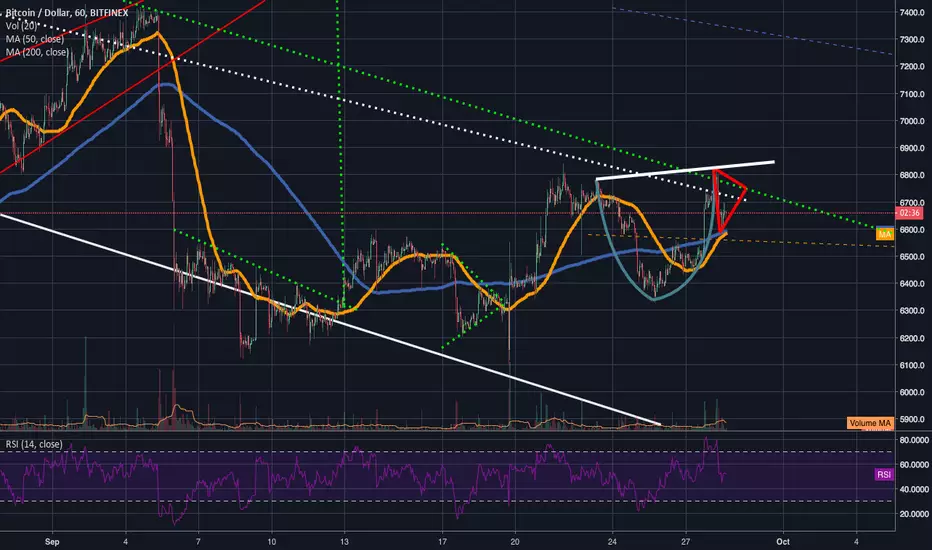
Slight chance @ both a C&H on 1hr btc chart & an inv h&s patternKeeping this idea neutral now because although both patterns are in play I don't have that high of confidence either will actually get triggered...the main one I'm gonna show first is this Cup & handle pattern that is forming on the 1 hr chart. We can see that the 1hr 50ma and 200ma are very close to completing a golden cross here and that the 200ma on the 1hr chart is so far holding support fairly well....the 200ma on the 1hr chart and the 200ma on the 4hr chart are sort of overlapping right now and acting as a kind of double reinforced support and the 4hr chart is also on the brink of a golden cross as well. If the 4hr charts 200ma can maintain support as well as the 50ma when it comes up above the 200ma if it maintains support I think these 2 patterns triggering can very much so become a reality but for now I'm not that confident in them only wanted to mention that they were worth keeping an eye on....below this in a follow up update I will post the inverted head and shoulder I decided to post it separately so you can more clearly see the cup and handle pattern but essentially the cup is the 2nd shoulder of the inv head and shoulder pattern.

Cup with handle on XRP !!We can see a Cup and Hands configuration on the XRP/USDT pair in 30 min time horizon. The theoretical objective of this chartist figure is equal to the depth of the cup which gives us a target around 0.60$.
As you know, technical analysis is not an exact science, so you should be careful if you decide to capitalize on this opportunity. If you enter the position, make sure you put a stop-loss below $0.5140 and move it up as the price increases.
Join us on : t.me/crypto_addicts_free

Potential Cup & Handle forming on XRP A Pattern worth keeping an eye on...price action is currently heading back towards the neckline.
BITCOIN IS STILL FOLLOWING THE CUPThere are lots of support/resistance points on the cup as you can see. Let's see how it plays out.

NCI Constructively forming handle base at 15.75 after 6-7w cupNCS
NCI is a near $2B business, which just merged with Ply Gem Corp. also $2B business forming larger construction and engineered products business
* Forming handle in likely break from Fibretrace 0.786 at $15.75 to $17.00 indicating break-out
* Drop to 14.10 not likely as relative strength and sales growth in construction and housing products after Hurricane Florence
* Fibretracement to 0.612 and 0.5 is 8 and 13% gain, however construction stocks grow on calender until Jan-Feb.
* Cup & handle formed once return to retrace 0.612 of $17.00 handle will be formed and NCS will jump to 18.75, 19.80 (+25%), 21.55 or 23 range nearing 52w high (23.35) based on typical resistance zones.
* Hurricane Florence will inpact Q3-4 sales. August earnings were 0.07 suprise at 0.54 from 0.47 expectations.
* No dividend and slight selling with insiders. Looking for 20% target here with handle form, and 25% entry now.
HD LOW

Inverted Cup & HandleToday is the day of inverted cup & handles, it's visible on many coin's charts.
For BTC target can be 6560.

A (almost) perfect Inverted Cup and HandleTarget can be 7000 if it not go lower.
It broke down exactly at the time of making it.

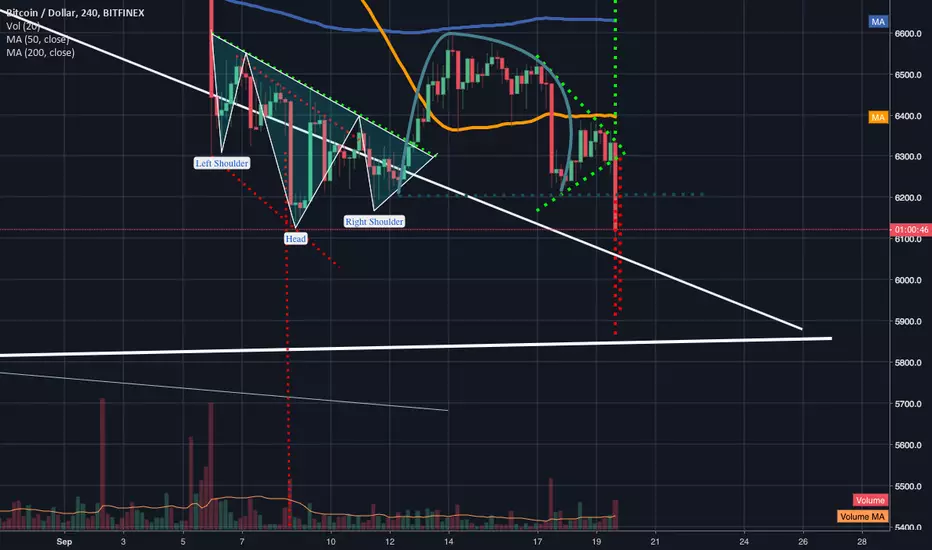
Inverted cup and handle spotted priceaction testing necklineIn dark turquoise here I ahve drawn an inverted cup and handle pattern...the price action has sent a wick to the neckline...should we not climb back into the symmetrical triangle by the time this candle closes probability is very high that we could trigger this cup and handle pattern...if so the target drop would be down to the bottom trendline of the weekly descending triangle pattern...I think we could see nice support there around 5845 or so. This may of course though be a bear trap and we still have time to climb back into the symmetrical triangle pattern before the candle closes...try to be prepared for both outcomes.
POLYPLEX - CUP PATTERN BREAKOUTCMP 616
Long suggested around 610-620.
Stop 575
Logic:
Weekly chart
Cup pattern breakout with good volumes.
Fundamentals - Exponential growth in EPS and sales observed in the last 4 quarters / D-E 0.3 / Promoter holding 51% / Mkt cap 1970 cr and FF 980 cr.
