Cupandhandlebreakout
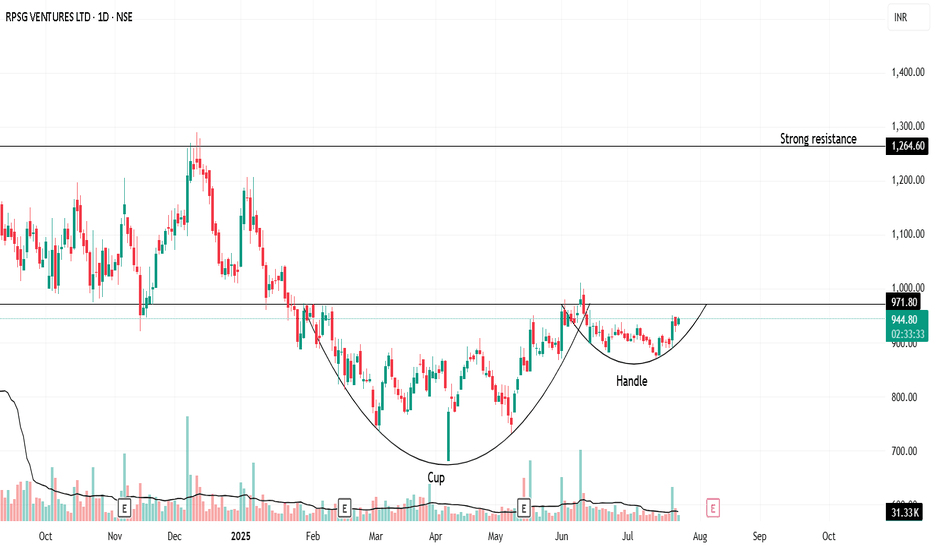
"Handle Tightening… Is RPSG Ready to Explode?"Once upon a trend, RPSG Ventures brewed a picture-perfect Cup & Handle—a structure born not out of coincidence, but crowd psychology and silent accumulation.
After nearly 9 months of consolidation, the stock crafted a deep, symmetrical cup (between November 2024 and May 2025). Traders forgot about it. Volumes dried. Hope faded.
But quietly, the handle formed—short, shallow, and tight. It’s not just a chart pattern—it’s a test of patience. And now, the breakout zone at ₹971.80 is like the rim of a boiling kettle: silent… until the whistle.
🧭 Possible Future?
If it breaks out: A rally toward ₹1,264 isn't just possible—it’s logical.
If it fakes out: Back to base, retest near ₹890.
💬 What makes this unique?
This isn’t just technical analysis. It’s a behavioral pattern. Fear, exhaustion, optimism—they're all baked into this structure. Cup & Handle isn’t bullish because of lines—it's bullish because it reflects crowd hesitation turning into confidence.
🚨 "Spill or Serve?" — comment below .
🧠 Watch the volume.
🛑 Don't jump the gun.
✅ Let the breakout come to you.
📜 Disclaimer:
This is not trading advice—this is pattern psychology in motion. Always consult your financial advisor before making real trades. This story is meant to provoke thought, not profits.
ASAN – Cup & Handle Breakout SetupASAN NYSE:ASAN has formed a classic Cup & Handle pattern and has broken above the neckline, turning previous resistance into new support. However, the price is still trading below both the 50 and 200 SMAs, which calls for cautious confirmation.
📌 Entry: Wait for a confirmed retest of the breakout level (new support) with healthy volume.
🔒 Stop Loss (SL): Just below the newly established support zone, in case of a failed retest.
🎯 Take Profit (TP):
First TP: Next visible resistance zone above.
If this level breaks and holds (confirmed by retest),
Next TP: The large gap overhead could potentially be filled.
This setup provides a strong risk-reward structure if confirmation aligns with volume and momentum. Avoid early entry without retest.
⚠️ DYOR (Do Your Own Research) – This is not financial advice.
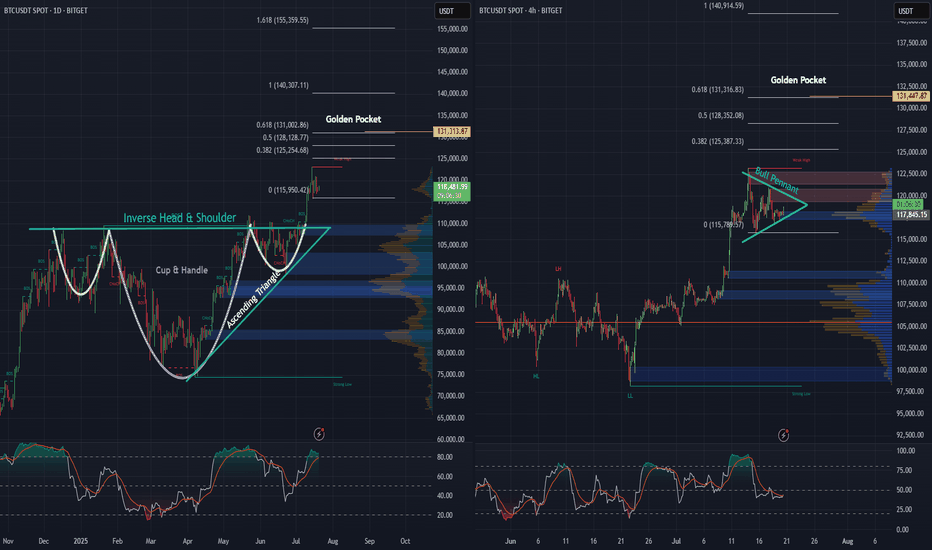
BTC daily, and 4 hr. Bullish Patterns Stack Up!Looking at the Daily and 4-hour charts for BTC, we can see multiple bullish formations unfolding.
An inverse head and shoulders - daily
A cup and handle - daily
An ascending triangle - daily
Price action looks strong, as we’ve begun the breakout from the neckline on the inverse H&S, as well as the cup and handle and ascending triangle simultaneously, and momentum is building fast.
Also, on the 4-hour chart, there’s a pretty substantial bull pennant taking shape. A breakout here could be the next leg up, and the push needed to keep momentum alive.
Zooming out, when we apply the trend-based Fibonacci extension, it reveals a $131,000 golden pocket, on both the the daily as well as the 4 hr. And that could be a major upside target if these bullish structures hold.
Stay tuned to see if BTC continues its move and sets a new all-time high.
MCLOUD : Post IPO Base Breakout#MCLOUD #IPOstock #breakout #momentumstock #patterntrading #cupandhandle
MCLOUD : Swing Trade
>> Post IPO Base Breakout
>> Cup & Handle Pattern
>> Trending Stock
>> Good Strength & Volume Building-up
Swing Traders can lock profit at 10% and keep trailing
Pls Boost, Comment & Follow for more analysis
Disc : Charts shared are for Learning purpose not a Trade Recommendation, Take postions only after consulting your Financial Advisor or a SEBI Registered Advisor.
SWIGGY - Breakout Soon (1-3 months)#SWIGGY #breakoutstock #patterntrading #cupandhandle #roundingbottom #trendingstock
SWIGGY : Swing Trade (1-3 Months)
>> Breakout candidate
>> Trending stock
>> Cup and handle pattern
>> Rounding bottom in the long run
>> Good Strength & Volumes Dried up
Swing Traders can lock profit at 10% and keep trailing
Pls Boost, Comment & Follow for more analysis
Disc : Charts shared are for Learning purpose not a Trade Recommendation, Take postions only after consulting your Financial Advisor or a SEBI Registered Advisor.
ETH | Bullish Pattern - Cup and Handle +15%A Bullish pattern is appearing on the Ethereum chart.
From a Cup and Handle pattern, we can easily expect atleast a 15% increase. This is true for the near term. A +15% would put us here:
Just under $3K we may see heavy resistance. This is also the neckline resistance, as it was the previous support for the breakout that ultimately led to a new ETH ATH.
_______________________________
BYBIT:ETHUSDT
THELEELATHELEELA is giving resistance + cup and handle breakout above 414 level. Market participation has also increased in recent sessions. So if it sustains and closes above 414 then it looks very attractive and may start new momentum rally. 398 seems very good support. On upper side we may see momentum of 10-12%. Make sure that it sustain and closes above 414!
Cup & Handle Formation.GFIL
Closed at 9.70 (30-06-2025)
Hidden Bullish Divergence on Bigger tf.
& Bullish Divergence on Daily tf.
If anyone wants to Take Fresh Entry, 6.30
should be the Stoploss.
Otherwise, wait for the Resistance (13.50) to
Cross & Sustain and then take Entry for
the Targets around 17 & then 23.
IRB INFRA: Cup & Consolidation Breakout🔍 Chart Analysis
The stock formed a textbook cup pattern, indicating accumulation after a long downtrend and also given 200 EMA breakout.
After forming the rounded base, it entered a tight consolidation range (highlighted in blue).
Today, the stock broke out of this range with strong bullish momentum and rising volume.
Immediate support lies at ₹49.25, the base of the consolidation box.
Next major hurdle: Strong resistance at ₹60.52, which aligns with a previous swing top.
📈 Why This Setup Looks Promising
Cup and handle patterns often precede major upward moves, especially when breakouts happen with volume.
Breakout from consolidation confirms bullish interest near ₹53 zone.
The stock has already corrected about 47% from its all-time high, offering a potential value opportunity if trend reversal sustains.
🎯 Levels to Watch
Support: ₹49.25
Resistance: ₹60.52
Breakout Confirmation Zone: ₹53.00–₹54.00
⚠️ Disclaimer
This is not investment advice. Please do your own research or consult your financial advisor before taking any position. The market is subject to risk and uncertainty.
RAILTELRAILTEL showing very good strength and currently trading above resistance line. It has also been observed cup and handle pattern breakout with decent increased volume in recent days. If I consider recent depth then we may see approx 30-33% rally in coming days provided that it holds and closing above 380 levels all the time. Strong up move is on the table!
Another Possible Setup of Cup & Handle
Closed at 120538.01 (03-06-2025)
Another Possible Setup of Cup &
Handle is appearing on Top.
But still Resistance od 120660 - 120700
is there.
If crossed, 123000 is on the cards.
On the flip side, slight bearish divergence is
there on shorter tf, so dip can be a buying
opportunity.
Hoping for a Good Move Upside! Inshaa ALLAH!
Cup & Handle Pattern and Inverse Head & Shoulder Breakout - CDSLTechnical Analysis:
Current Price: ₹1408.8 (Note: Live prices can fluctuate. As of the market close on May 16, 2025, CDSL closed around ₹1417.00 on the NSE).
Target: Your target of ₹1800 suggests a significant potential upside.
Cup & Handle Pattern Breakout: This bullish continuation pattern, if confirmed, indicates potential for a strong upward move.
Inverse Head & Shoulder Breakout: This is a bullish reversal pattern, suggesting the end of a downtrend and the start of an uptrend. The confluence of these two bullish patterns adds strength to the potential upside.
Time Frame: A 1 to 3-month timeframe is reasonable for these patterns to play out, assuming the breakouts are sustained.
Confirming the Breakouts:
Volume: It's crucial to assess if both breakouts were accompanied by a noticeable increase in trading volume. Strong volume adds conviction to the validity of the breakouts.
Sustainability: Monitor if the price holds above the breakout levels in the coming trading sessions.
Potential Upside:
Target (₹1800): Represents a potential upside of approximately 27.8% from the ₹1408.8 level (or around 26.9% from the ₹1417.00 closing price).
Quarterly and Yearly Results & EPS Comparison:
Latest Quarter Result (March 2025): CDSL reported a consolidated net profit of ₹100.31 Crore, a decrease of -22.4% compared to the same quarter last year (March 2024). The total income for the quarter was ₹255.78 Crore, a decrease of -4.34% YoY.
Yearly Result (FY2025): For the full fiscal year ending March 2025, CDSL's total revenue stood at ₹984.58 Crore, a growth of 32.53% compared to the previous fiscal year (FY2024). The profit after tax for FY25 was ₹462.10 Crore, a growth of 27.19% YoY.
EPS Comparison:
Quarterly EPS (March 2025): ₹3.86, compared to ₹4.66 in March 2024.
Yearly EPS (FY2025): ₹22.11, compared to ₹34.77 in FY2024. The yearly EPS shows a decrease despite revenue and profit growth, which could be due to an increase in the number of outstanding shares or other accounting adjustments.
P/E Comparison:
Based on the closing price of ₹1417.00 and the TTM (Trailing Twelve Months) EPS of approximately ₹25.20, the current P/E ratio is around 56.23.
Comparing this to peers like Computer Age Management Services (CAMS) with a P/E of around 43.73 and KFin Technologies with a P/E of around 55.97 (as of recent data), CDSL's P/E is in a similar range or slightly higher than some peers.
Corporate Action:
Dividend: CDSL has declared a final dividend of ₹12.50 per share for the fiscal year ending March 31, 2025, subject to shareholder approval. The ex-dividend date and payment date will be announced later.
In the quarter ending March 2024, CDSL declared a dividend of ₹3 per share.
Key Factors to Monitor:
Breakout Confirmation: Watch for sustained price action above the breakout levels with good volume for both the Cup & Handle and Inverse Head & Shoulder patterns.
Earnings Impact: Analyze how the market reacts to the recent quarterly and yearly results. While the yearly revenue and profit showed growth, the decrease in quarterly profit and yearly EPS might be a point of concern for some investors.
Market Sentiment: Overall market sentiment and the performance of the financial services sector will influence CDSL's price.
Dividend Announcement: Keep an eye on the record date and payment date for the declared dividend.
ASAHI SONGWON : Chart Pattern Breakout#ASAHISONG #cupandhandle #chartpattern #breakout #swingtrade #swingtrading
ASAHISONG : Swing Trade
>> Chart Pattern Breakout soon
>> Cup & Handle Visible
>> Volumes Dried up
>> Good Strength in Stock
Swing Traders can lock Profit at 10% and keep Trailing
Disc : Charts shared are for study Purpose & not a Trade Recommendation
Pls do uour Own Analysis or Consult ur Financial Advisor before taking any position, Dont go all in...plan ur Trades with Proper Position Sizing, Risk Management and clear plan.


