Carvana ready to fulfill a true cup & handle breakout over $57Looks like CVNA is ready to breakout in a cup/ handle. Everyone said that it broke out already and is now dying down. But the final handle/ falling wedge is showing signs of a breakout. I posted this at $42 last week but re-emphasizing at $44. As long as you hedge you're not late.
You can capitalize on both ups and downs if you have insurance (hedge).
Cupandhandlebreakout

LUKSO - Stacked Cup & Handles w/Solid Momentum Volume #LYXE #LYX
This Lukso fractal with slow rounded & stacked cup & handles while stair stepping up, paired with massive momentum volume, probably nothing...

Get ready to Stand-up and Salute the Flag - Happiest MindsHappiest Minds is a Leader in digital transformation IT consulting & services company focusing on Big Data, Analytics Cloud, Mobility & Security for better business development.
After the IPO in Sep 2020 the stock saw a Dream Run in less than 1 year to reach a Skyhigh milestone of 1600 from a mere 300 / stock. After this its been in a consolidation mode for nearly 2+ years forming a Standout Flag Pole pattern on Monthly
Here are the Technicals behind the Amazing Bull Run Setup:
Monthly: Flag Pole BO above 960 for Target of 1600++
Weekly: There are 2 Cup and Handle patterns. One with a Cup and Parallel Channel Handle and other with a Cup and Inv H&S inside the Handle.
The completion of INv H&S pattern will enable BO of the Flag pattern to take the stock sky high again
Disclaimer:
3+ Years Teaching Experience in Stock Market - Technical Analysis, Advanced Patterns, Emotional Management, News based Trading...
We are NOT SEBI Registered
Our focus is NOT providing Buy/Sell Recommendations/calls
Primary Objective is to provide detailed analysis of how to review a chart, explain multi--timeframe views purely for Educational Purposes.
We strongly suggest our followers to "Learn to Ride the Tide irrespective of its Side"
*** Important *** Consult your Financial Advisors before taking any positions
If you like our detailed analysis, please do rate us with your Likes, Boost and share your comments
-Team Stocks-n-Trends

SPELS Semiconductor about to "Spell-Out" MagicSPELS Semiconductor is one of the first stock in India venturing into the Semi-Conductor space and with the recent push for Make-in-India scheme and the Growing demand of Semi-Conductor worldwide + the Anti-China policy (China+1) adopted by many countries, India has become a Favourite Hotspot for Semi-conductor manufacturing
Let's look at the Technicals of SPELS:
Getting ready to Blast. 3 Amazing Bullish Structures
1. Monthly - Large C&H - BO above 105 WCB for target of 200++ (2x opportunity)
2. Weekly - Inv H&S - BO already done target 99
3. Daily - Flag Pole BO - Happening - buy above 80 WCB for Target of 102
Each lower timeframe BO will take to the next Higher Timeframe BO zone. Multibagger pick. already 40% up from our Recommended Levels
Disclaimer:
3+ Years Teaching Experience in Stock Market - Technical Analysis, Advanced Patterns, Emotional Management, News based Trading...
We are NOT SEBI Registered
Our focus is NOT providing Buy/Sell Recommendations/calls
Primary Objective is to provide detailed analysis of how to review a chart, explain multi--timeframe views purely for Educational Purposes.
We strongly suggest our followers to "Learn to Ride the Tide irrespective of its Side"
*** Important *** Consult your Financial Advisors before taking any positions
If you like our detailed analysis, please do rate us with your Likes, Boost and share your comments
-Team Stocks-n-Trends

Kiss of the Tiger :)Tigerlogistics - A Small Cap company (having a market cap of Rs 833.27 Crore) operating in Logistics sector. The initial call on Tiger Logistics was given around 440. Today it surpassed 866 levels in Intraday resulting in a gain of nearly 97%
Technicals:
1) On Monthly - The Rally on Tiger started with a Cup and Handle BO above 290 levels. Further to this, it rallied up and took a 0.382 Fib retracement to form a Fresh Rounding Bottom Pattern
2) BO of new RB was done above 480 and targets were set for 625, 700
3) On Weekly - it again formed a smaller rounding bottom pattern with BO above 600 by which time the Targets were extended to 866
4) There is also a Parallel Channel seen on Weekly with the Price coming closer to upper Trendline resistance
Today the Tiger "Kissed the Target of 866" during Intraday but fell down slightly towards day close. We expect a slight retracement from Upper Trendline before the Tiger starts Pouncing to next higher level - 1200+ based on Fib Extension
Disclaimer:
Stocks-n-Trends is NOT a SEBI registered company. We do not provide Buy / Sell recommendations - rather we provide detailed analysis of how to review a chart, explain multi--timeframe views purely for Educational Purposes. We strongly suggest our followers to "Learn to Ride the Tide" and consult your Financial Advisors before taking any positions.
If you like our detailed analysis, please do rate us with your Likes, Boost and share your comments
-Team Stocks-n-Trends

Blasting Oxidation Starts at Pondy Oxides & Chemicals :) :) :)The Chemical Sector was looking Super Bullish when compared to the Nifty 50. Many Chemical stocks were hitting Sky high last week.
Pondy Oxides & Chemicals is a Multi-bagger stock which already gave me more than 2x-3x returns last year. I booked my profits and after brief gap I re-entered the stock again in Q3/Q4 2023 and now it has given me 55% returns so far.
Technicals:
Weekly: Cup & Handle BO Completed with target of 785
Monthly: With 20% UC today - it has broken out of Another much Larger C&H pattern at Monthly levels for a 2x Target of 1300+
The Oxidation has just started - don't give up now.....The Real Blast is yet to happen. Keep holding your winners
Disclaimer:
Stocks-n-Trends is NOT a SEBI registered company. We do not provide Buy / Sell recommendations - rather we provide detailed analysis of how to review a chart, explain multi--timeframe views purely for Educational Purposes. We strongly suggest our followers to "Learn to Ride the Tide" and consult your Financial Advisors before taking any positions.
If you like our detailed analysis, please do rate us with your Likes, Boost and share your comments
-Team Stocks-n-Trends

The Next Blockbuster Film - B.A.G Films & MediaNifty Media India is on the Verge of Break out. On Monthly timeframe - There is a Beautiful Cup and Handle Structure with an embedded Inv Head and Shoulder inside the Handle
With the Media Index brimming near breakout level - some of the Media stocks are also at same situation
B.A.G Films & Media - one such stock which has recently completed a 12 Year Breakout in December and rising 62% already in just 1 week of Jan 2024.
Monthly Timeframe shows - Inverted Head & Shoulder pattern (BO done) and currently facing another Multi-year resistance. Once above 16 WCB the stock would hit a Blockbuster run to 19, 27 and finally long term target of 105
Dont miss this multi-bagger
Disclaimer:
Stocks-n-Trends is NOT a SEBI registered company. We do not provide Buy / Sell recommendations - rather we provide detailed analysis of how to review a chart, explain multi--timeframe views purely for Educational Purposes. We strongly suggest our followers to "Learn to Ride the Tide" and consult your Financial Advisors before taking any positions.
If you like our detailed analysis, please do rate us with your Likes, Boost and share your comments
-Team Stocks-n-Trends

Endurance Tech - Amazing 2 Cups of Morning Hot CoffeeYesterday after market close - we published chart of Nifty IT stating the IT Sector would snap the 5 day Fall and would bounce back today
Reasons for IT bounce:
Double Top neckline Support (not broken)
2 support lines from the Gap Up candle (one support at top of Gap and one at bottom)
Good rejection seen from DT neckline + both ends of Gap - and price closed just above the Support lines
Overall Indian markets turned bullish across all sectors despite weak Global cues from US, Europe & Asia
Today - as predicted, NIFTY IT index rose 1.35% in the morning taking all IT stocks sky high
Endurance Tech:
Double Cup & Handle Pattern (one on Weekly & one on Monthly) gave me the Morning Boost of Caffeine already :)
Monthly: Large Cup & Handle (Slanting) with BO above 2350 and Target 3800
Weekly: Inside the larger Handle - on weekly scale another Cup & Handle was formed and BO already done 2 weeks ago with target of 2450.
Today's rejection is from the Larger C&H Trendline - which is also expected. One Cup of Coffee done - another one pending :)
Keep holding your winners. Remember - we (Stocks-n-Trends) are NOT SEBI registered entity and our focus is not to provide calls. We rather Teach you how to use Technical Analysis to make money yourselves. Learn to Ride the Tide whatever be its Side :)
- Team Stocks-n-Trends

The Least Expected Multi-Bagger - RPowerMulti-baggers are identified in several ways - based on the Sector they operate, based on Management Conviction, Based on the product portfolio, Global Demand etc...
But identifying a Multi-bagger from "Scrap" is extremely difficult, because by that time people would have made solid impressions that its a "Loser", "Worst Performer" etc...
In the business of stock market - we can't afford to have Pre-judgements about particular stock, sector. The only thing that defines growth & future is "Support and Resistance" Levels. When a stock sky-rockets in short time, we call it best performer - without realizing the fact that it is NOT forming any Support levels behind it. (Example: IRCTC, IEX etc...) - Everyone wants a share of the company in FOMO. But when it falls - there is no support to catch it - everyone starts shouting, yelling, cursing the stock as "Worst Performer". Forget Emotions - Trade with understanding how a stock has to Grow & Fall. You will be able to Mine the Multi-bagger
One such Script is RPower (Reliance Power).
2 Major Decisive Breakouts on Monthly
1) Multi-Year Falling Parallel Channel BO above 25
2) Cup and Handle BO above same 25 level
Just look at the Volume Builtup on Monthly to confirm the structure
It has reached the 1st target of 29 (provided as part of previous patterns on September). Now the next Targets are 37, 45
Disclaimer:
Stocks-n-Trends is NOT a SEBI registered company. We do not provide Buy / Sell recommendations - rather we provide detailed analysis of how to review a chart, explain multi--timeframe views purely for Educational Purposes. We strongly suggest our followers to "Learn to Ride the Tide" and consult your Financial Advisors before taking any positions.
If you like our detailed analysis, please do rate us with your Likes, Boost and share your comments
-Team Stocks-n-Trends

Mining thru the Miner Stock - VedantaMulti-Timeframe Analysis of Vedanta:
Decoding the Dividend Yield
Vedanta Ltd has been a Cash Cow atleast for past 2-3 years from a Dividend Perspective. More than the Stock price gain - It has provided Dividend Yield of more than 40% since 2022. A large portion of Dividend yields was being utilized to settle the Parent Company's Debt in UK. It was like a Collateral "Gains" for us - the retail investors - who also got big chunk of Dividends. I used to say in a funny way "As long as Vedanta is in Debt - I will enjoy Hefty Dividends" :) This is real and realized profits unlike the stock prices which goes up and down
Flag Pole Break Out on Monthly Chart
As you can see, VEDL has completed a Flag Pattern BO on Monthly level with huge target of 488
Multi-Bullish Patterns on Daily Chart
On the Daily - there are multiple bullish Patterns
1. Cup and Handle - BO started today
2. Inv Head & Shoulder embedded inside the Cup - Target Reached
3. While forming the Handle portion - it also completed the BO - Retest of Flag Pattern which is a Very Healthy sign
Vedanta is all set to Shine Bright & Hot in the upcoming days - especially when the Metal Index is also on BO - there is no stopping for this beauty now :) :) :)

India's Non-Stop Bullet Train - TEXRAIL - Choo Choo Train :)TEXRAIL turned out to be a Multi-bagger in 2023. The initial call was given at 64 for a target of 116, 136, 157. It blasted all 3 targets in less than 8 months resulting in a profit of more than 2.75x - Amazing Isn't it
Recently the Indian Govt has announced major investment of more than 1 Lakh Crores into Railways & Infrastructure and among the Railway Themed Stocks - TEXRAIL plays a prominent Role.
Our Multi-Timeframe Analysis shows following results
1. Monthly - Huge Cup & Handle BO done with targets of 240, 290
2. Daily - Even on the Shorter Term - It looks Super Bullish above 180 resistance levels. Another Smaller Cup & Handle BO done at Daily TF with target of 215
All we need is a strong close above 181-185 WCB for the Choo Choo Train to Blow its Horns and Chug along :)
Disclaimer:
Stocks-n-Trends is NOT a SEBI registered company. We do not provide Buy / Sell recommendations - rather we provide detailed analysis of how to review a chart, explain multi--timeframe views purely for Educational Purposes. We strongly suggest our followers to "Learn to Ride the Tide" and consult your Financial Advisors before taking any positions.
If you like our detailed analysis, please do rate us with your Likes, Boost and share your comments
-Team Stocks-n-Trends

The Sun Shines Bright - Surya Roshini - 20% UCSurya Roshini - one of the largest Steel Pipes and Lighting companies in India shined bright on Friday (Dec 29) when it got locked in 20% UC
This 20% was backed with 2 important milestones:
1) Cup & Handle BO supported with Volume @ Monthly TF
2) Multi-Year Parallel Channel BO as well
3) Target for C&H BO is 965
Break-out Traders - What to watch for, Can we Trade this at CMP ? What will happen on Tuesday ? Read our analysis below:
1) Typically stocks which BO tend to Retest the BO zone - To find this out we need to do Multi-timeframe analysis
2) On Weekly Charts - we also notice a smaller Parallel Channel with an embedded Box pattern BO
3) Despite the 20% UC - the stock ended right on the resistance of Parallel Channel Trendline - and infact it was rejected just at market close couple of points below 20%
Given this, Tuesday opening is important - It has to open above the smaller Parallel Channel and ensure that it sustains above this channel the whole day. A rejection within the channel would lead to sideways consolidation between 577 to 777 before taking a BO to reach the Target
Avoid FOMO - ensure we invest our money at right time so our returns are not delayed. Risky players - may take entry at CMP for 50% and keep remaining funds to average "if" there is a retracement. Safe players - wait for Retracement and let it take support before taking positions

ZENSARTECH: Brewing Success in a Cup and Handle FormationZENSARTECH (CMP: 617.35) presents a compelling opportunity with the formation of a classic cup and handle pattern. This bullish technical setup suggests a potential upward trend reversal, making it an exciting prospect for traders and investors.
Key Points:
Cup and Handle Formation:
The stock has traced a cup-like pattern, indicating a period of consolidation and accumulation, followed by a smaller pullback forming the handle. This pattern often precedes a significant upward move.
Current Market Price (CMP):
The current market price at 617.35 positions us at the potential breakout point, providing an advantageous entry for those looking to ride the anticipated bullish momentum.
Stop Loss at 455:
To manage risk, a prudent stop-loss level has been set at 455. This level is strategically chosen to allow for a reasonable buffer while protecting against unexpected downturns.
Target at 1365:
The target of 1365 aligns with the projected upward move based on the cup and handle pattern. This ambitious but realistic target takes into account the depth of the cup and offers an attractive risk-reward ratio.
Important Note:
I am not a SEBI registered advisor. Trading involves risk, and it's crucial to stay updated on market conditions and adapt your strategy accordingly. This idea is based on technical analysis, and it's recommended to conduct thorough research and, if possible, consult with financial professionals before making any trading decisions.

Netflix in large Cup and Handle PatternNetflix appears to me to be completing a large cup and handle pattern. The initial peak of the cup appears at a price level of about $485 while the base appears to be at a low of $345. This price difference is $140, so I suggest the possibility that a new price target for NFLX should be at $625.
The handle has just been broken in the upward price direction and I am trading this to that price target unless invalidation occurs. I am watching for the stock price to hold the $485 support that was once previously a resistance to confirm the trend and avoid invalidating the technical formation.

RUN AWYRUN AWY GAP UP TRADING
CUP WITH HANDEL PATTER BREAKOUT
Voice BUILDING FROM the Last Three Sessions
21SMA 277
50SMA 268
200SMA 229

Cup with handle BO in $NSE:LTNSE:LT
Pattern details:
Up-trend before forming Cup with handle pattern
Cup with ~8% correction and length of cup 22 bars (31 days)
Handle length is 8 bars (13 days) and ~3% correction.
BO Volumes are good
Disc - invested, for educational purposes only

Electronics Mart has Cup and Handle pattern by William O'neilStock has made breakout from cup and handle pattern which didn't retrace more than 0.382 Fibonacci of previous rally. This pattern was developed by William O'Neil and introduced in his 1988 book, How to Make Money in Stocks.
Electronics Mart has a potential to 2-3x from here onwards as sales were also good in recent quarter. Entry 227 with small stop at gap near 207/190 as per your risk capacity.
DISCLAIMER:
There is no guarantee of profits or no exceptions from losses.
The stock and its levels discussed are solely the personal views of my research.
You are advised to rely on your judgement while investing/Trading decisions.
Seek help of your financial advisor before investing/trading.
Investment Warnings:
We would like to draw your attention to the following important investment warnings.
-Investment is subject to market risks.
-The value of shares and investments and the income derived from them can go down as well as up.
-Investors may not get back the amount they invested - losing one's shirt is a real risk.
-Past performance is not a guide to future performance.
-I may or may not trade this analysis
--------------------------(((((LIKE)))))-------------------------------

GTA VI Effect?Take Two Interactive, while on the downward sloping trend has formed a cup & handle pattern and successfully managed to break out of the range. The arrival of next Grand Theft Auto series is likely to push the stock up as it is likely to be one of the best selling titles in the gaming industry.
The stock has many supporting reasons to drive its price higher as we may see the continuation of GTA Online (for both V & VI) which has been a massive success amongst the community and also for Rockstar as it has helped generate regular income from its business model. Other than being the best GTA ever, it will incorporate features from other successful titles such as Red Dead Redemption 2, which arguably had better graphics than GTA V & all other games from the parent company in the past. We may also see Rockstar borrowing elements from RDR 2 like character physics & animals such as horses which have never been present in GTA before. This will be biggest & best release ever from the GTA series unlike Apple claiming their Iphone to be which is merely different from its previous iterations.
Moreover, the stock is down from its all time high and thus we can expect to see it breaking its previous highs with the next GTA on its cards. The stock looks good for a long term holding as Rockstar has high estimates from its upcoming titles in 2024-25 and none other than next GTA can achieve this level of sales. Rockstar has other upcoming titles too in the pipeline that may contribute to their success in the future.

fundamental stockEverest Kanto Cylinder Ltd. (EKC) is engaged in the manufacture of high-pressure seamless gas cylinders along with other cylinders and equipment used for containing and storing natural gas, liquids, and air.
155 is the next resistance for the stock
my target is 180 with stop loss of 115
155 level can achieve in next two sessions.
no recognition for buy and sell

GBP/USD Potential Bullish Reversal - Cup and Handle FormationGBP/USD is currently on the verge of the lower boundary of an upward channel and forming a Cup and Handle pattern, indicating a potential bullish reversal. The entry point may occur after the price successfully breaks and retests the SNR level at 1.23113.
Technical Analysis:
-The Cup and Handle pattern is forming, signaling a potential bullish reversal.
-The price is approaching the lower boundary of the upward channel.
-SNR level at 1.23113 is a critical point for breakout confirmation.
Trade Plan:
-Entry Point: Wait for the price to break and retest the SNR level at 1.23113.
-Stop-Loss: Place a stop-loss below the nearest support level or according to your personal risk tolerance.
-Profit Target: Set a realistic profit target, possibly at the next resistance level (1.25497)
Special Considerations:
-Monitor economic news and fundamental factors that may affect GBP/USD.
-Do not hesitate to exit the trade if there are significant changes in market conditions.

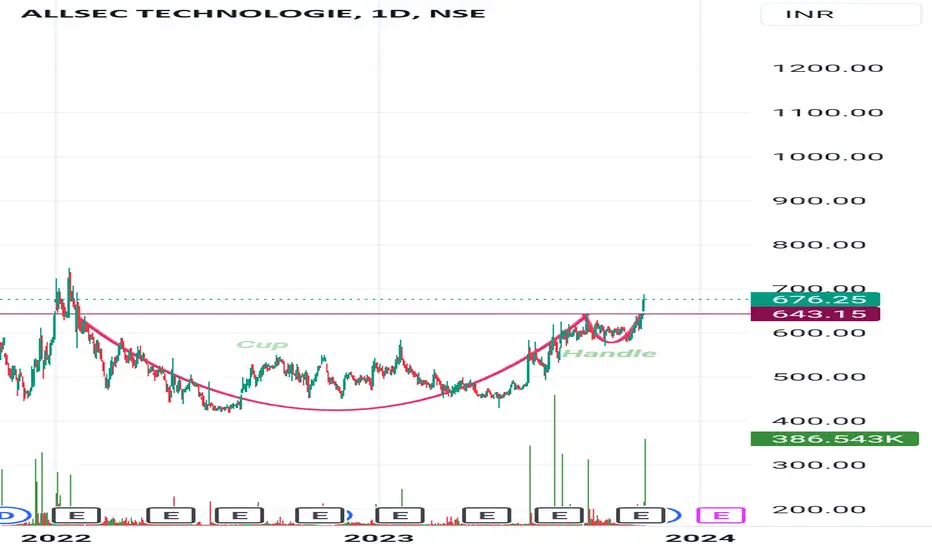
Cup with handle
Incorporated in 1998, Allsec Tech is a global leader in outsourcing solutions offering future-ready, resilient business transformation services to industry heavy-weights, Fortune 100 companies, and growth-focused organizations. The services provided by the Company include data verification, processing of orders received through telephone calls, telemarketing, monitoring quality of calls of other call centers, customer services and HR and payroll processing. The Company has delivery centers at Chennai, Bengaluru and NCR.
With 4,000+ FTEs spread across 5 contact centers in the US, Philippines, and India, the company manages over 1 Million customer contacts per day, via multiple touchpoints.
WABAG - Cup with handle BO NSE:WABAG
As seen on the chart, Va Tech Wabag Ltd has formed a nice U-shaped Cup, and the volume was low when it was forming the handle and the breakout was with a good volume.
There is a high probability that this pattern will be successful.
Disc - invested, for educational purposes only
Another similar setup was with Finolex Cables

FinolexCable Cup and handle formation breakout
NSE:FINCABLES
As seen on the chart, Finolex Cables have formed a nice U-shaped Cup and the handle is also not very deep.
Also, the volume was low when it was forming the handle and the breakout was with a significantly higher volume for the handle.
There is a high probability that this pattern will be successful.
Disc - invested, for educational purposes only.
