GBP/USD Potential Bullish Reversal - Cup and Handle FormationGBP/USD is currently on the verge of the lower boundary of an upward channel and forming a Cup and Handle pattern, indicating a potential bullish reversal. The entry point may occur after the price successfully breaks and retests the SNR level at 1.23113.
Technical Analysis:
-The Cup and Handle pattern is forming, signaling a potential bullish reversal.
-The price is approaching the lower boundary of the upward channel.
-SNR level at 1.23113 is a critical point for breakout confirmation.
Trade Plan:
-Entry Point: Wait for the price to break and retest the SNR level at 1.23113.
-Stop-Loss: Place a stop-loss below the nearest support level or according to your personal risk tolerance.
-Profit Target: Set a realistic profit target, possibly at the next resistance level (1.25497)
Special Considerations:
-Monitor economic news and fundamental factors that may affect GBP/USD.
-Do not hesitate to exit the trade if there are significant changes in market conditions.
Cupandhandlebreakout

Cup with handle
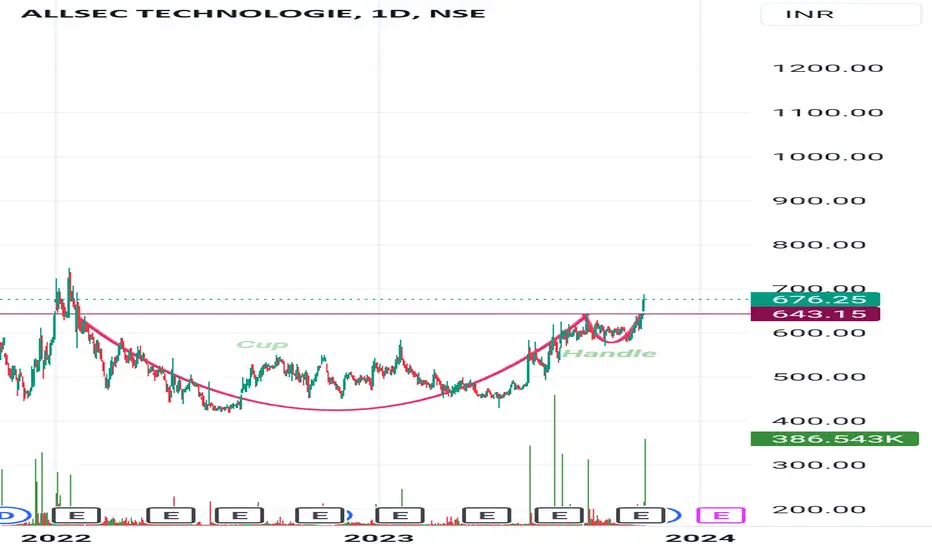
Incorporated in 1998, Allsec Tech is a global leader in outsourcing solutions offering future-ready, resilient business transformation services to industry heavy-weights, Fortune 100 companies, and growth-focused organizations. The services provided by the Company include data verification, processing of orders received through telephone calls, telemarketing, monitoring quality of calls of other call centers, customer services and HR and payroll processing. The Company has delivery centers at Chennai, Bengaluru and NCR.
With 4,000+ FTEs spread across 5 contact centers in the US, Philippines, and India, the company manages over 1 Million customer contacts per day, via multiple touchpoints.
WABAG - Cup with handle BO NSE:WABAG
As seen on the chart, Va Tech Wabag Ltd has formed a nice U-shaped Cup, and the volume was low when it was forming the handle and the breakout was with a good volume.
There is a high probability that this pattern will be successful.
Disc - invested, for educational purposes only
Another similar setup was with Finolex Cables

FinolexCable Cup and handle formation breakout
NSE:FINCABLES
As seen on the chart, Finolex Cables have formed a nice U-shaped Cup and the handle is also not very deep.
Also, the volume was low when it was forming the handle and the breakout was with a significantly higher volume for the handle.
There is a high probability that this pattern will be successful.
Disc - invested, for educational purposes only.

$LEMONTREE - Cup with handle BOAs seen on the chart, NSE:LEMONTREE has formed a nice U-shaped Cup,
The stock was in an uptrend before forming Cup
Took 38 weeks to form the complete pattern.
27 weeks for Cup with a correction of ~27%
11 weeks for Handle with a correction of ~10%
Volume dried up during the initial part of the cup and handle.
But was good when coming out of the cup and also at the BO of the handle.
There is a high probability that this pattern will be successful.
With regard to quarterly results,
Total revenue was INR ~222 crores, which increased 16.8% year-on-year.
The net EBITDA margin in Q1 stood at ~47%
The PAT grew by 103% year-on-year from INR 13.6 crores to INR 27.5 crores.
Disc - invested, for educational purposes only
Another similar setup was with Finolex Cables and Va Tech Wabag Ltd

long cup and handlethis chart breakout 2017 high with cup and handle pattern so this give beautiful result.
6500 is my target as per this breakout
no recommendation for any buying or selling
take own analysis

cup and handle pattern in 15 minutes chart of bankniftycup and handle pattern in 15 minutes chart of banknifty

Nasdaq shows C+H pattern and just broke the handle We see the classic cup & handle pattern in the Nasdaq 100, where currently the handle in the downtrend was broken upwards and retested. Thus, further highs are expected, above the previous 52w high and then the ATH.
Furthermore, with Friday's close, the MA50 in 4H was exceeded, which is also bullish.

AR/USDT.P Cup and Handle structure setting upI see a Cup and Handle structure forming on the Hourly chart for AR/USDT.P on the MEXC chart.
The video explains my analysis.
What do you think?
Where would you enter for a nice Inter-day scalp?
More information about the indicators I am using is in my profile
Good luck out there! :)

UXY 4 Hr 103 Target Cup-Handle PatternUXY 4 Hr 103 Target Cup-Handle Pattern
UXY 4 Hr 101.450 above
101.720 Above candle Close
Activation Cup-Handle Pattern

ABCAPITAL - Cup and Handle patternAll details are given on chart. If you like the analyses please do share it with your friends, like and follow me for more such interesting charts.
Disc - Am not a SEBI registered. Please do your own analyses before taking position. This post is only for educational purposes and not a trading recommendation.

Cup & Handle Breakout: Bullish Measured MovePrice target 4575 based on extension from bottom of cup to rim.
Breakout above rim is bullish and high probability of further extension.
Bottom of cup 4330 to rim 4455 = +125, target ~4575.
Move can come fast. Shorts beware.
NB: Chart patterns are often DECEPTIVE and MISLEADING. DYODD!
A pullback to fill the open gap is very likely. Closing the gap may spark further rally towards target price.
FOMC rate hike next week could be catalyst to crush this rally, risk is high for all positions!

Oracle fin services weakly chart Orecle finance services weakly chart have reversal header and shoulder pattern, market in bullish and our stock have breakout so this also leads to move as bullish stock in the part of Nifty small cap 100
No recommendation for buy or sell

TEJAS NETWORKS : LongTejas network has broken the cup and handle and met the first target and is approaching to second and third targets.
Entry: 874
Not a good risk reward
First target: 925
First Stoploss: 794
Good risk reward
Second target: 1024
Second Stoploss: 725

NIFTY - Cup and Handle Breakout on Weekly T/FNifty has broken out of a Cup and Handle pattern on weekly timeframe after consolidating around the resistance area of 18600.
Going by the depth of the cup, we can estimate a target range of 21000 to 22000 in the coming months along with minor corrections on the way.
Broadly, 18600 should be the strongest support for the rest of this year.
With the softening of inflation in US and a possible Fed decision to pause interest rate hikes, an extended bull run on the index cannot be ruled out.

Cup & Handle Breakout in USDJPYUSDJPY did breakout from cup and handle formation at 138 zone. The price retraced toward the breakout zone and was hovering sideways for 8-10 trading sessions before finally pushing on the bullish side (on the US Dollar).
The price seem to have completed the retracement after the breakout at 138 zone and looks ready to continue upward in the direction of the breakout.
Longs can be initiated on the USDJPY pair for 148.85 as the measured move target. SL below 138.40.
Note, BoJ may come to interrupt the bullish flow of this chart once again, so be nimble and prepared to reverse positions upon any plausible bearish central bank action.

8030: C&H Formation (Dow_Bullish)Classical C&H pattern formation
Series of HH, HL
Ride the trend.
Trade with trailing SL
Manage your Risk properly

CIPLA : Cup and Handle breakout : 8-10% up-movePromising up move. short term target 1000/-
Cup and handle breakout and BO retest done.

Learn How to Trade Cup and Handle (rare but profitable pattern)☕
If you are studying a price action, you should definitely know Cup and Handle formation.
Being applied properly, it can generate big profits.
In this educational article, I will teach you how to identify this pattern. We will discuss its psychology and I will share with you 2 trading strategies.
📏And let's start with the structure of the pattern.
The pattern has 3 important elements:
Cup - long-term correctional movement that tends to move steadily from a bearish trend to a bullish trend.
Handle - short-term correctional movement with signs of bullish strength.
Neckline - upper horizontal boundary of the pattern - a strong resistance that the price constantly respects.
⚠️Being formed, it warns you about a highly probable coming bullish movement.
The trigger that confirms the initiation of a bullish wave is a breakout of the neckline of the pattern and a candle close above.
Here is the example of a completed C&H with a confirmed neckline breakout, indicating a highly probably coming bullish movement.
Depending on the preceding price action, Cup & Handle Pattern can either be a trend-following or reversal pattern.
📉If the pattern is formed after a bearish impulse. It is considered to be a reversal pattern.
Here is the example of a reversal C&H that I spotted on EURUSD.
📈If the pattern is formed at the top of a bullish impulse, it is considered to be a trend following pattern.
Here is the example of a trend following C&H that I spotted on GBPJPY Index.
The thing is that while the price forms the C&H, buying volumes are accumulating. Even though, buyers are hesitant and reluctant initially, their confidence grows, and the accumulation leads to explosive neckline breakout.
There are 2 strategies to trade this pattern.
✔️Strategy 1.
That approach is quite risky, but the reward can be quite substantial.
You should monitor the price action when the price is forming a handle. Occasionally, the price starts trading in a falling channel: parallel or contracting one.
Your trigger will be a bullish breakout of its resistance and a candle close above.
Once the violation is confirmed, you can buy aggressively or set a buy limit order on a retest.
Stop loss will lie below the lows of the channel.
Target will be the closest key resistance.
Here is the example of the handle being a falling channel.
📍Strategy 2.
Wait for a breakout of a neckline of the pattern.
Once a candle closes above that, it will confirm the violation.
Buy the market aggressively or set a buy limit on a retest of a broken neckline then.
Stop loss will lie below the lows of the handle.
Target will be the closest key resistance.
Here is the example of the trade based on a confirmed breakout of a neckline of C&P on NASDAQ Index.
Applied properly, the strategies may reach up to 70% win rate.
As always, the best pattern will be the one that forms on a key level.
Try it, test it, and good luck in your trading journey.
❤️Please, support my work with like, thank you!❤️

Double Pattern MoveThis is an updated idea of my previous post where I discovered a cup & handle pattern. However, on a relook I noticed that there is a double pattern formation. It can be seen in this post that a ascending triangle pattern is engulfing a cup & handle pattern, both signaling an upmove.

Cup & Handle BreakoutDespite the market performing sluggish and out of sync with other indexes viz Nifty, Bank Nifty & Fin Nifty, this classical Cup & Handle pattern formed which subtly broke out giving an upmove for the trend continuation. Patterns are your best bet when nothing else gives confirmation!

2280_Breakout (ATH)_Cup & HandlePrice at ATH
Wait for minor correction
Keep Stop Loss Intact for long term entry
Short term target, parallel channel top
Cup & Handle Formation, Long term targets are specified
Stop Loss below Previous All Time High (ATH) or 58.5

TSLA Cup & Handle Bullish ContinuationTSLA as shown on the 60 minute chart has been in a cup and handle since the last earnings
report. Trading volumes increased then and the print is a gradual downtrend reversed to a
gradual uptrend then the handle formation and finally the breakout above the lip of the cup.
TSLA and Ford this week announced collaboration on a charging network primarily with Ford
customers getting use on existing TSLA stations and both companies expanding the network.
Perhaps this mutually benefits both companies. China holding interest rates and perhaps
lowering them more easily allows financing of new Telsas in TSLA's biggest market. Based
on the technicals about the cup and handle and the height of the cup. the pattern which has
good reliability predicts bullish continuation of $40 upside. In consideration of this I will
take a trade of an additional 2 contracts ( strike $180 Exp mid November).
