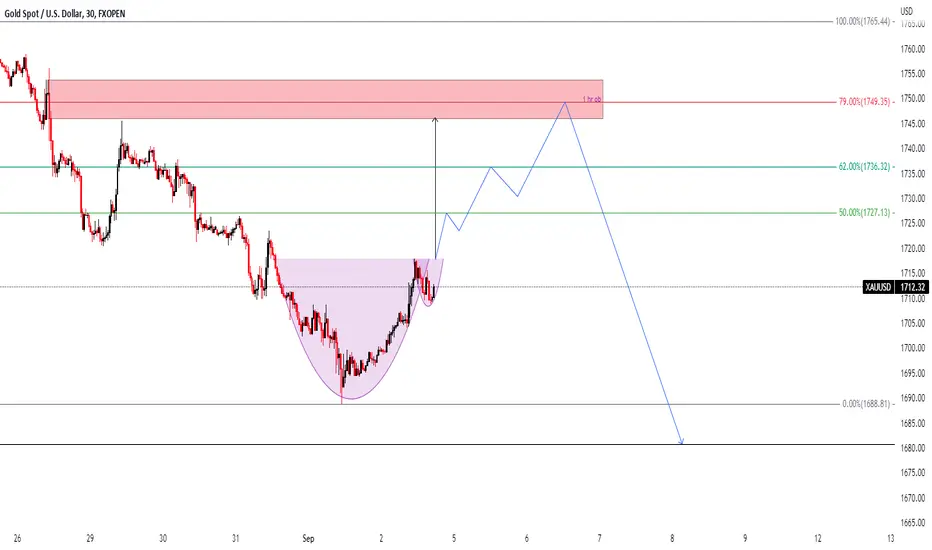
gold longlooking for this setup for the next week as gold is makinga a cup and handel formation and the target for reaches wxactly to the 1 hr OB whic will make a supply and drop to 1680
Cupandhandlepattern
Mahindra holidays amd resorts india LtdMahindra holidays amd resorts india Ltd good for swing trading
Buying this stock also because cup and handle pattern is forming
volume is hingh
cup and handle breakout
BUY =286.45
Stop loss=261
1st target =308
2nd target=331
⚠️ Important: Always maintain your Risk & Reward Ratio.
✅Like and follow to never miss a new idea!✅
Disclaimer: I am not SEBI Registered Advisor. My posts are purely for training and educational purposes.
Eat🍜 Sleep😴 TradingView📈 Repeat 🔁

CanfinHomesCanfinhomes made cup n handle pattern on daily charts with very good volumes & trading above neckline comfortably.
Could be bought with mentioned stoploss & targets.

Gold Bear market incoming - down to 1686, 1440?
As we can see we have both a Double top, as well as a reversed cup & handle pattern on the weekly chart. Both announce a bearish sentiment to the market for the coming months if correct. We can see gold retest 1680 level as it did 18/07, breaking that (very strong) support could cause the pair to depreciate to 1440-1446.
I am personally opening a smaller lot, long-term sell position, TP1 set at 1686, TP2 set 1512.5.
Don't risk opening big lots on such trades, this process could take months, we also need to remember to take external factors into consideration.
Let me know what you think!

DXY cup and handle 2022DXY cup and handle 2022? Target $114. The DXY has been on a tear and this could be bad for risk-on assets like crypto.

Combined value of AMC+APE daily candlesIf AMC = APE then why not chart them together? Is this a Cup and Handle?

$GOOG and GOOGLE serving us a big cup of tea, can you handle itBig cup & handle wyckoff accumulation schematic developing on GOOGLE!
This level is make it or break it.
$GOOG hasn't had the the most exciting price action lately but we could be in for a big surprise to the upside if it can hold this current level. Gaps to the upside.
IF NOT.. support levels are marked to the downside.
It's decision time.

$NFG gas industry leader near breakoutNational Fuel Gas Co l is a diversified energy organization headquartered in Western New York that operates an integrated collection of natural gas and oil assets across four business segments: exploration and production, pipeline and storage, gathering, and utility.
The stock is in a confirmed uptrend and has formed a cup & handle with a buy point at $73.
Investors Business Daily gives a Relative Strength rating of 92 and Ranks the stock first in its industry.
AMEX:UNG had a really bad day yesterday which could affect NYSE:NFG and the rest of the industry.
I'll let the price guide me. If it breakouts with heavy volume I'll buy. If not, then I won't buy. Simple.

TRADE ALERT - LONG NWCEntry = .0.167
Stop Loss = 0.137
Final Target = 0.24
Risk/Reward = 3/5
Leverage = 1x
Profit Potential = 52%

BNB: Bearish Inverse Cup & Handle!!Hello Guys,
BNB is looking bearish here. It is forming inverse cup & handle pattern (which is generally a bearish pattern).
Important support area is $273-$278 (support line of inverse cup & handle pattern).
If it breaks below the support then we can see more dump ($250ish area)
You can open a short position after breakdown of support area with low leverage.
SL: Above $311
if you like this idea then do support it with like and follow for more.
Also, share your views in the comment section.
Thank You!

DOT cup and handle#DOT/USDT
$DOT shaped a Cup & Handle pattern in 1h time frame!
🐮 breaking out the middle and upper line of descending channel that is the handle will confirm this pattern and will bring it up to touch 2 fib level of the cup which is around $8.4.
🐻 breaks down from the lower line of channel will invalid this pattern and can drop price to middle line of daily descending channel around $7.

$DLTR, CMT Investment Challenge - 1st TradeDolar Tree is in a confirmed uptrend and after a retest on support at $125, the price has formed a cup & handle with less of 30% throwback, this correction came after bad news on NYSE:WMT . That's why stocks like NASDAQ:DLTR and NYSE:DG came right back up. This shows strength and leadership in its industry.
Inside the handle it has formed a shark pattern with pivot buy at $169. This volatility contraction usually signals that an agressive move could follow. My stop loss is just below last week's low.
Investors Business Daily gives a RS rating of 96 and Ranks the stock in 2nd in its industry behind NYSE:BJ .
The retail leader has reported 4 quarters in a row with YoY growth. Last quarter published a +6% in revenue, +34% in profit margins and +48% in EPS growth. This fundamentals may act as a driver for institutions to buy the stock.

WAKE UP DEGEN! ETH Cup and Handle !Such an obvious trade, how can you be this stupid to short here.
Blatantly obvious cup and handle opportunity, sure it can be invalidated but the risk to reward here is too high to pass up.
Ripping a fat juicy trade here, not financial advice.

CUP AND HANDLE TO SHOOT US TO BEAR MARKET RESISTANCE LINEIf we can hold this level (which has strong support at the 200d MA, we should be able to form this cup and handle breakout back into the $2000's

BGRIM | Elliott Wave Analysis - Leading Diagonal Cup HandlePrice action and chart pattern trading
> Cup & Handle pattern with a leading diagonal wave forming the cup handle, possibly iv-wave correction targeting EMA70 slightly below the lower channel support
> Expecting a candlestick tight formation for reversal pattern formation before entering a long entry.
> The target 3-wave confirmation should break out the upper channel resistance.
> The final target of cup & handle at 2.618 extension zone

XAUUSD SPOT GOLD LONG SWING Cup & Handle PatternOANDA:XAUUSD
The 4H XAUAUD is set up on the finish of a cup and handle pattern
and so bullish continuation is about to ensue.
The chart shows the depth /height of the cup.
I will enter when the basis of the Bollinger Bands reverses into an uptrend.
Stop loss will be outside the LBB at that time or alternatively the recent swing low.
Targets, as drawn to the chart, are the POC of the volume profile, the triple top of June
and the double top of May as also shown with arrows.
I expect this to be a high probability trade for a few months with a high yield compared
with the risk. Teh gold bull run will be fueled by continued inflation the erosion of
dollar value (DXY) as well as fear and the flight to safety (VIX).
What is your opinion ?
