Cup & Handle and Trendline Breakout - GMDC LTDTechnical Analysis:
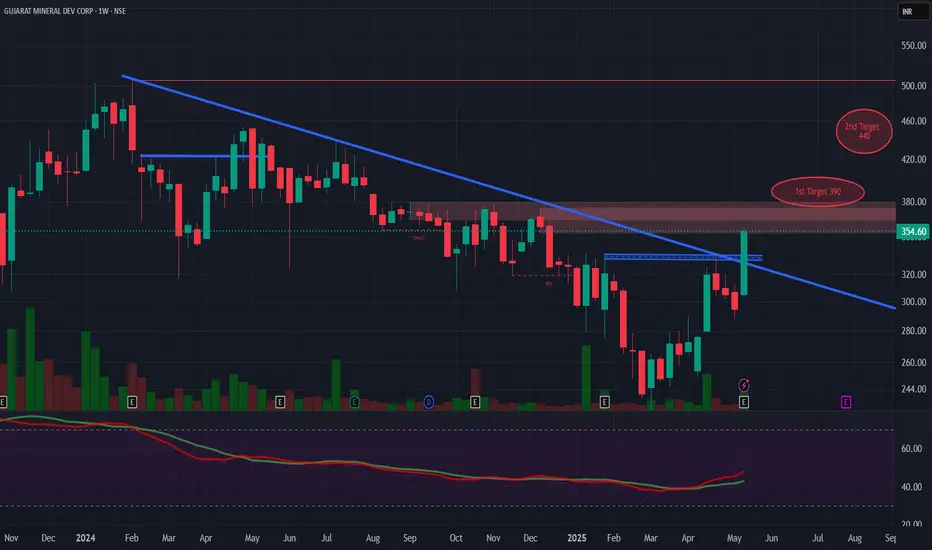
Current Price: ₹354 (Note: Live prices can fluctuate. As of the latest information available, GMDCLTD closed around ₹349.95 on May 16, 2025).
Targets: Your targets of ₹390 and ₹440 suggest a potential significant upside.
Cup & Handle Pattern Breakout: This is a bullish continuation pattern, and a breakout suggests a potential move higher.
Trendline Breakout: Breaking above a significant trendline also indicates potential bullish momentum.
Time Frame: A 1 to 3-month timeframe is a reasonable expectation for these patterns to play out, assuming the breakouts are sustained.
Confirming the Breakouts:
Volume: It's crucial to assess if the breakouts were accompanied by a noticeable increase in trading volume. Strong volume adds conviction to the validity of the breakouts.
Sustainability: Monitor if the price holds above the breakout levels in the coming trading sessions.
Potential Upside:
Target 1 (₹390): Represents an approximate 10.29% upside from the ₹354 level (or around 11.44% from the ₹349.95 closing price).
Target 2 (₹440): Represents a more significant potential upside of around 24.29% from ₹354 (or about 25.73% from ₹349.95).
Quarterly and Yearly Results & EPS Comparison:
Based on the available information (primarily data up to December 2024):
Latest Quarter Result (December 2024): GMDCLTD reported a rise of 26.39% in consolidated net profit. Sales also increased by 15.80% to ₹653.42 crore.
EPS (TTM - Trailing Twelve Months): The EPS for the trailing twelve months is around ₹20.97 (as per some sources).
To provide a more precise comparison of quarterly and yearly EPS, we would need the specific figures for the most recent quarters and the full financial year ending March 2025, which the company is expected to announce.
Key Factors to Monitor:
Breakout Confirmation: Watch for sustained price action above the breakout levels with good volume.
Upcoming Results: Keep an eye on the full-year results and any further quarterly results announcements, as these can significantly impact the stock price. The board meeting to consider these was held on May 15, 2025.
Sector Performance: The performance of the mining and minerals sector can also influence GMDCLTD.
Technical Indicators: Using other technical indicators like RSI and MACD can help confirm the bullish momentum.
Cuphandlebreakout
Classic Cup & Handle Breakout & Re-testVery simple - a classic cup and handle formation, already confirmed and re-testing a breakout:
- has already broken out of the handle forming a 2nd smaller cup
- and since broken above and held above the weekly cup's neckline
It has held above for several weeks and is now re-testing that neckline.
Targets are TP 1 and 2, measured from the length of the bottom of cup to its neckline, from its neckline up (TP 1) and then a half length above that (TP 2).
Conditions for hitting take profit targets are:
A.) holding the neckline or
B.) a weekly candle close with a pullback below that quickly reclaims it in the following week or so.

AMZN solid earnings high volume for 10 months Cup and HandleAMZN has risen lately above the lip of the cup of the pattern on this 4H chart. The pattern
suggests $ 50 USD upside or 35% beyond present price. The chart shows the buying coming
in once price reached a rounded bottom an began an uptrend. Earnings beats have been
significant especially compared with the miss a year ago. AMZN is like the massive river with
branches feeding the volume of the river's depth and breadth downstream. Its dominance
and resilience is impeccable like others in the titans of tech. Price is now in the ascending
bullish continuation portion of the handle. I see this as a setup for a long swing stock trade
as AMZN heads into the next earnings. Another long play is call options in five weeks at
$ 156 or six months expiration at $176 strike which is the head and shoulders pattern of 2021.
