Cupnhandle
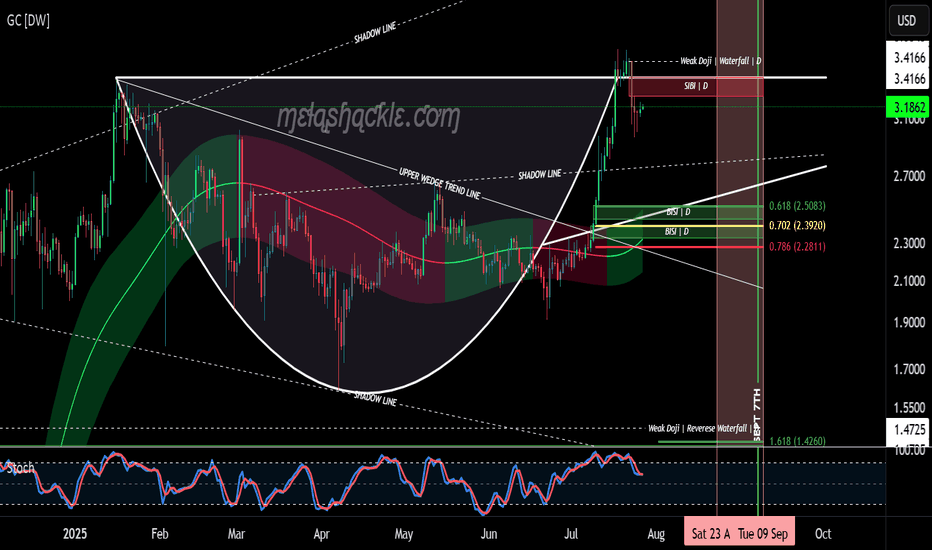
XRP Cup & Handle Pattern on the Daily Chart.XRP is now forming the handle on a very nice cup-and-handle pattern on the daily chart, starting at the previous all-time high set on January 16th, 2025.
But this pattern isn’t all sunshine and rainbows. The price of XRP could drop down into the $2.50 range—toward the bullish fair value gaps I’ve outlined at the bottom of the handle—before making any credible gains or a major breakout to higher levels.
I do believe we’ll see much higher prices in XRP in the coming years as we continue moving into the new global digital financial system. However, for this pattern to fully play out, there will likely be some pain before the pleasure.
I’d keep a close eye on the pink area marked on the charts—spanning from August 23rd through September 8th—as a potential zone for bearish price action.
Luckily for me, my XRP bags have been filled since before the Trump election pump, so I don’t personally need to buy more—unless I see a clear buying opportunity.
Good luck, everyone!
Cup and Handle Formation in Angelone ChartDisclaimer : Do your own research before investing. This is just a chart analysis for education purpose only. No recommendation to buy and sell.
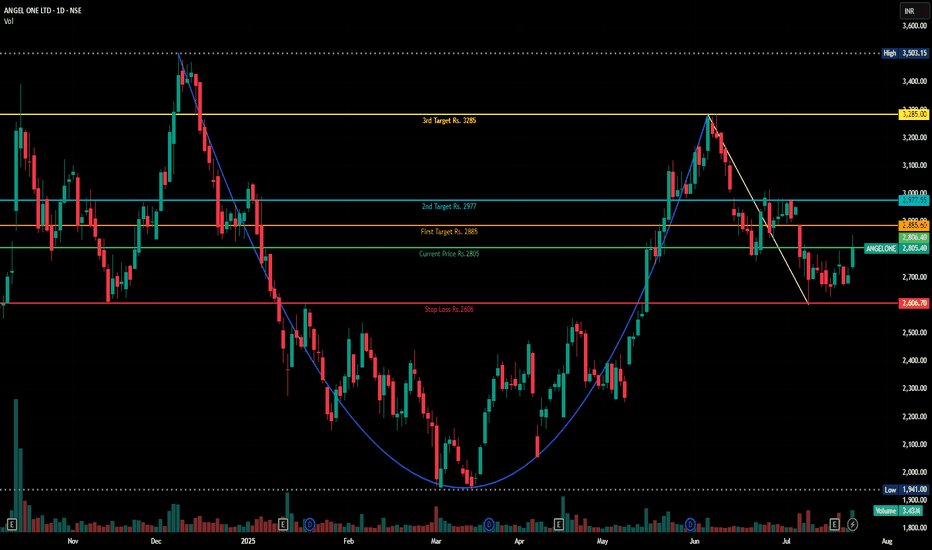
In Dec 2024, AngelOne made high of Rs.3500 and pull back to level of Rs.1941 in March 2025.
After touching level of Rs. 3288 , its now trading at Rs. 2805.
I can see a cup and handle chart pattern formation in this stock. to me , it will be bullish in near to long term.
I have mentioned my targets along with stop loss.
IRB INFRA: Cup & Consolidation Breakout🔍 Chart Analysis
The stock formed a textbook cup pattern, indicating accumulation after a long downtrend and also given 200 EMA breakout.
After forming the rounded base, it entered a tight consolidation range (highlighted in blue).
Today, the stock broke out of this range with strong bullish momentum and rising volume.
Immediate support lies at ₹49.25, the base of the consolidation box.
Next major hurdle: Strong resistance at ₹60.52, which aligns with a previous swing top.
📈 Why This Setup Looks Promising
Cup and handle patterns often precede major upward moves, especially when breakouts happen with volume.
Breakout from consolidation confirms bullish interest near ₹53 zone.
The stock has already corrected about 47% from its all-time high, offering a potential value opportunity if trend reversal sustains.
🎯 Levels to Watch
Support: ₹49.25
Resistance: ₹60.52
Breakout Confirmation Zone: ₹53.00–₹54.00
⚠️ Disclaimer
This is not investment advice. Please do your own research or consult your financial advisor before taking any position. The market is subject to risk and uncertainty.
The handle is now forming on a massive cup & handle on SOL.SOL is now forming the handle of a massive cup-and-handle pattern that has taken over three years to develop. If SOL breaks out of this pattern in the coming months, we could very well see a four-digit price moving forward.
Keep your eyes on this.
Good luck, and always use a stop-loss!
TOTAL CRYPTO MARKET CAP is back-testing the cup & handle patternIt's no mystery that the crypto market has been getting hit pretty hard since mid-December. However, the total market cap—which had previously broken out of a nice cup-and-handle pattern—is now backtesting the rim line and looks to be setting up for what could be an incredible move upward over the next 6 to 9 months, with the potential for a double within that timeframe.
Good luck, and always use a stop loss!
ONDO appears to have a bright future ahead!ONDO is a favorite cryptocurrency of many investors and traders alike. The entire crypto market has been dragged down since December after the massive gains from the "Trump election pump" caused many cryptos to go ballistic. However, the future looks bright for ONDO, as the current weekly chart suggests it's setting up for another leg up.
Good luck, and always use a stop-loss!
I'm $HIMS: Before & After All Time Highs!I'm NYSE:HIMS : Before & After
Imagine saying this pattern is forced and then watching it run for over 20% while engulfing the ATH candles!
Stop hating on other people's work!
Either be a student to those giving out free information, or don't say anything at all!
Not financial advice
SILVER | The longest timeframe cup & handle in history!SILVER has been forming a cup-and-handle pattern for the past 45 years. And even though SILVER has made some incredible moves during that time, its price has been blatantly manipulated by the LBMA (London Bullion Market Association), central banks around the world, and a completely fraudulent derivatives market that circulates fake paper silver at hundreds of times greater than the underlying asset. Prices have been artificially suppressed for decades to prop up the global fake fiat currency Ponzi scheme and tighten the grip of control over nearly every asset and human being—making these fake currencies appear legitimate when they are clearly instruments of debt and deception.
This artificial suppression of SILVER and many other commodities is coming to an end as the debt-and-death paradigm unravels before our very eyes.
The day is rapidly approaching when SILVER will enter true price discovery, and people will not believe the price points it will reach in the very near future. Silver is one of the most—if not the most—undervalued physical assets of all time.
Good luck, and always use a stop-loss!
ONDO has nice potential if it pulls back to the proper buy zone.ONDO has been on a tear lately with the rest of the crypto market, and some really good opportunities could present themselves 'if' it pulls back into the proper discount buy zone. The fair value gap, or just above it, could present the perfect opportunity for a lower risk entry. Higher risk entries could present themselves within the corresponding fib zones. But I wouldn't chase price. Instead, have patience and let the price come to you.
Good luck, and always use a stop-loss!
Ascending Triangle on the Daily for GME!Alright folks, brace yourselves for another electrifying update on the saga of GME! Since our last rendezvous, we've witnessed the impressive cup and handle pattern and the striking inverse head and shoulders breakout. But that was just the beginning. After our latest dip, in tune with the broader market's downturn, we've now sculpted an absolute monster of an Ascending Triangle on the daily chart, also visible even on the 4-hour.
Using the trend-based Fibonacci extension, the golden pocket awaits us at $37.09, with the next pocket above that at $52.58. Adding to the excitement, we've got the Bull Flag breaking out on the weekly chart and the golden cross appearing on both the weekly and daily charts. Not to forget the substantial cup and handle formation on the hourly chart.
Hourly Chart : Cup and Handle: This pattern is setting the stage for potential bullish movement.
4-Hour Chart: Ascending Triangle: Reinforces the pattern seen on the daily chart, confirming the bullish setup.
Daily Chart: Ascending Triangle: Visible on both the daily and 4-hour charts, suggesting an imminent breakout.
Weekly: Golden Cross: This crossover indicates long-term bullish momentum.
Bull Flag: This continuation pattern indicates that the existing uptrend is likely to continue.
All signs point to an explosive few months ahead for GME, with multiple breakouts on the horizon. Stay tuned, because the next chapter of this epic journey is about to unfold
BITCOIN Cup & Handle Pattern has yet to see its full potential.Bitcoin has been forming a massive cup-and-handle pattern, which I pointed out a long before it was common knowledge. Even with the new all-time highs it has already set, broken, and set again, it has still yet to realize its full potential.
Many are just now starting to realize that the bull run we are currently experiencing isn't like previous bull run cycles and is operating in a way that's unlike anything we've seen before. 'Altcoin season' may very well end up becoming a permanent Bitcoin season if this trend continues.
Good luck, and always use a stop loss!
SOL Cup & Handle pattern approaching the key breakout area.SOLANA has been building a massive cup-and-handle pattern for over four years and has yet to break out. There was a small, false breakout after the November 5th election of President Donald Trump, but the pattern has not yet played out to its full potential.
I believe that during the upcoming 'alt-coin' season, up until mid-2025, we will see SOL, at a minimum, 2X to 3X in value. On the extreme side, it could even rise as high as 10X.
Either way, SOLANA holders will be more than satisfied, assuming there are no unpredictable events that could hinder SOL's inevitable rise through price discovery to new all-time highs.
Good luck, and always use a stop loss!
I'm Still Bullish On Solana - Targeting $375Though Solana broke down the $204 support, it has failed to break below our white ascending trendline. This support has held and in fact has carried us upward since Dec. 20th. If my Cup and Handle is to remain valid, our support must continue to hold. If not, all bets are off. Though, the handle is a bit deeper than I'd like to see, I'm going to continue to respect this as a pattern unless that support breaks. My target remains $375, nearly a full 2x from here!
✌️Stew
Inverted Head & Shoulders, Cup & Handle, Bull Flag GME DailyHey, everyone. It's that time again for the latest market update on GME. The charts are buzzing with activity, and we have some exciting developments to share.
Currently, we are trading within a substantial Bull Pennant on both the 15-minute and 1-hour charts. This indicates strong consolidation and potential for a significant move upwards. Additionally, we have a Bull Flag on the 4-hour chart, adding to the bullish sentiment.
On the daily timeframe, we've formed an impressive Cup & Handle, an Inverse Head & Shoulders, and a Bull Flag for the handle of the cup. These patterns are powerful indicators of potential upward momentum.
But that's not all! We are also in the midst of a significant Golden Cross on both the daily and weekly charts. This crossover of moving averages is a strong bullish signal, suggesting that we could be on the verge of a major uptrend.
Here’s a detailed technical breakdown:
15-minute chart: Bull Pennant
1-hour chart: Bull Pennant
4-hour chart: Bull Flag
Daily chart: Cup & Handle , Inverse Head & Shoulders , and Bull Flag
Weekly chart: Bull Flag & Golden Cross
For those who are new to these updates, it's worth noting the historical context: The last time GME had a Golden Cross on the weekly chart was back in January 2021. Following that, GME saw an incredible 12,000% run over just 183 trading days.
With the return of the Kitty and all systems go across all timeframes, the stage is set for a potentially explosive movement. Stay tuned and be ready for what promises to be an exhilarating ride.
HIMS 8/17 - THE STOCK GAUNTLET CONTINUES! HIMS & HERS ⚔️🛡️ THE STOCK GAUNTLET CONTINUES!
STOCK/ TRADE SETUP UPDATE: 8/17
8⃣ HIMS - HIMS & HERS
Video Analysis below:
Show some love by: ❤️
LIKING l FOLLOWING l SHARING
Hit the🔔as well to be notified when each video drops
NFA #TradingTips #HIGHFIVESETUP
NYSE:HIMS
NYSE:HIMS
[C&H] TRON is creating base for move up higherKRAKEN:TRXUSD seem to have broken out of a cup and handle pattern and in process of retest/consolidation. It might retest the breakout zone around 0.143 before a move up higher. Note that all time highest close (higher green line) would likely act as resistance but if we manage to break past it then we should see 0.41 levels as per the height of C&H pattern.
From Elliott wave perspective though, it looks much more bullish with a potential target of 1.12 in medium term. Will share the counts in a separate post.


