Things may be looking UP for HBAR!HBAR has formed a clear cup & handle formation, and is nearly completed the handle. All that's left at this point is for the price to breakout of the handle wedge.
I would be cautious with this particular play, and look for a bullish engulfing candle previous to the breakout candle, and run a tight stop until you breakout above the upper cup trend line. (White dashed line)
Good luck!
Cupnhandle

REEF is about to retest the previous high set before the crash!REEF was a victim of the recent Bitcoin ETF crash just like 95% of other crypto's. It's been gaining momentum once again, climbing the tiers and will likely retest the previous high that was set yesterday.

Crazy analysis of Cardano #ADAHello guys!
adausd has formed a cup and handle pattern and its handle will continue to touch FL zone i mean $0.22 and after that this cryptocurrency can break out handle and touch main target for sure (final target $19)
i know this is crazy but what is not!!!
If you agree with my analysis or you are happy, please hit the "like" button and "follow"!

TRU trade setup looks absolutely incredible!The current cup & handle setup that has been forming is absolutely incredible looking! The recent down-thrust looks to have formed the bottom foundation of the formation's handle. I'm waiting patiently for the price to retest the breakout level from the "Bitcoin Approval Rally.'
I will be putting a long position on in that area when my charts give me the signal. This trade setup would work better on a higher dollar/lower leverage entry vs. in my opinion as it will take some time for this pattern to play out to its finality. If you use leverage, make sure that you keep it reasonable (10 - 20x), and keep extra funds in your account to give you a larger spread from your Liquidation Price to assist you in avoiding that dreaded 4 o'clock liquidation candle the Market Maker's love to throw at us in the middle of the night while we're tucked into bed sawing logs.
Good luck!

REEF breaking out of the descending wedge pattern.REEF was taken down hard the past couple of days by market makers, yet has still managed to breakout of the descending wedge pattern on a day when it's deep in the red. The 4 hour chart looks absolutely incredible!
I took a long position at .00159 and will be adding to it as the trade progresses.
These are the only indicators that I use. In my opinion they're the best combination available for trading. (With stock volume and 200 D.M.A.) Try them, you can thank me later!
- Haos Visual Divergence + Volume Analysis
- TTM Squeeze Pro
- Stoch MTM
- SMI MFI

REEF cup & handle - handle formation divergence.As per my previous REEF chart posting, REEF has formed a massive cup & handle formation and is now working on the formation of the handle itself. The white triangle represents the area that the handle formation is occurring. Currently there is a divergence between the price action and the H.V.D. Volume Analysis Indicator which looks to be a good sign that the price action will be moving upwards to the white dashed line to continue building the handle.
I think this is going to be a very substantial, positive price move once the price action breaks out of the handle formation.
These are the only indicators that I use, and in my opinion they're the best combination available for trading. (With stock volume and 200 D.M.A.) My P & L clearly demonstrates this fact.
- Haos Visual Divergence + Volume Analysis
- TTM Squeeze Pro
- Stoch MTM
- SMI MFI

HBAR will DOUBLE in the next 6 to 8 weeks!HBAR has been forming a very clear cup & handle formation for the past 10 months (since February 2023), and is now starting to work on creating the handle. HBAR has nearly doubled since mid October and over the next six to eight weeks WILL DOUBLE AGAIN!
Pick your spots, pack your bags and buckle your seatbelts!
The journey to the moon first starts with an ignition!

REEF looks like it could be getting ready to bounce!Reef has finished forming the cup and is now working on the handle.

TruFi just flashed a buy signal!TRU/TruFi has formed a clear cup & handle on the daily chart, and just flashed a clear buy signal on the hourly according to my personal trading perimeters. Although I'm not completely sold on this particular chart I would rate this trade a 7/10.

Hammering candle Cup and handle pattern
Breakout with volume
Hammering candle
Bullish chart
Breakout with volume
No recommendation for buy and sell

15 MIN showing a Bull flag, Cup & Handle, and an Inverse H & STracking 3 bullish trends on GME 15 MIN. a Bull Flag, Cup & Handle, and an Inverted Head and Shoulders. Lets see how this plays out. If we use the FIB EXT as a gauge we could see a bounce to 17.80 on the 15..

fundamental stockEverest Kanto Cylinder Ltd. (EKC) is engaged in the manufacture of high-pressure seamless gas cylinders along with other cylinders and equipment used for containing and storing natural gas, liquids, and air.
155 is the next resistance for the stock
my target is 180 with stop loss of 115
155 level can achieve in next two sessions.
no recognition for buy and sell

Cup with handle
Incorporated in 1998, Allsec Tech is a global leader in outsourcing solutions offering future-ready, resilient business transformation services to industry heavy-weights, Fortune 100 companies, and growth-focused organizations. The services provided by the Company include data verification, processing of orders received through telephone calls, telemarketing, monitoring quality of calls of other call centers, customer services and HR and payroll processing. The Company has delivery centers at Chennai, Bengaluru and NCR.
With 4,000+ FTEs spread across 5 contact centers in the US, Philippines, and India, the company manages over 1 Million customer contacts per day, via multiple touchpoints.
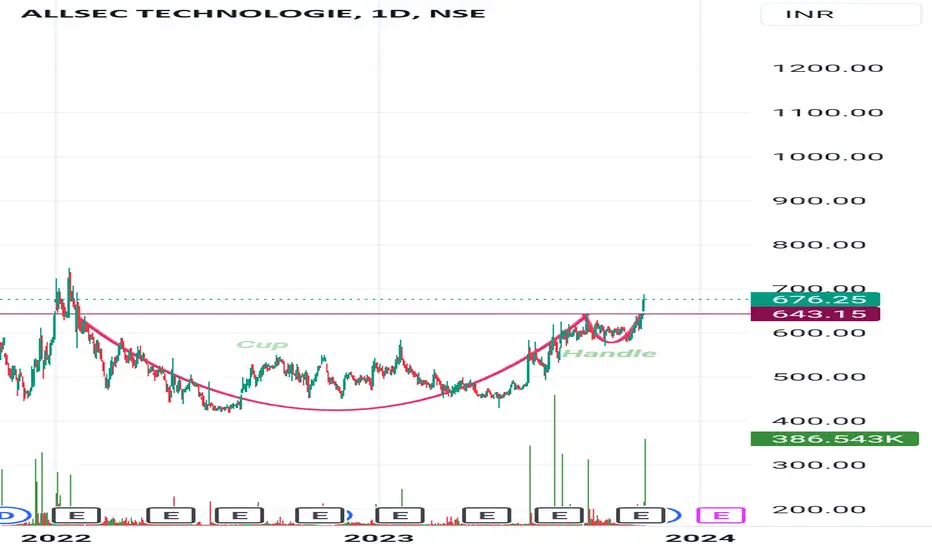
long cup and handlethis chart breakout 2017 high with cup and handle pattern so this give beautiful result.
6500 is my target as per this breakout
no recommendation for any buying or selling
take own analysis

How To Identify and Trade a Cup & HandleThe Cup & Handle Pattern:
A Comprehensive Guide to Continuation Mastery
In the vast realm of technical analysis, the Cup & Handle pattern emerges as a brilliant beacon of insight—an extraordinary exemplar of a continuation pattern that elegantly unveils the ongoing momentum within an established trend. Its inherent elegance lies in its unparalleled ability to furnish traders with a tangible roadmap, skillfully guiding them through the intricate symphony of price action. As we embark on this enlightening journey of exploration, we shall unveil the multifaceted layers of the Cup & Handle pattern. Our expedition involves an in-depth dissection of its core components, a profound interpretation of its implications, and an unveiling of the critical elements that lend credence to its presence.
1. Cup Formation: The Artful Pause That Speaks Volumes
Nestled at the heart of the Cup & Handle pattern is the captivating creation of the cup formation—a graceful curve that mirrors the contours of a masterfully sculpted cup. This stage encapsulates a momentary respite, a purposeful consolidation within the overarching trend. It embodies a pause that echoes the collective sentiment of market participants, offering a tangible representation of forces seeking equilibrium. The gentle curvature of the cup resonates with the rhythm of the market, seamlessly weaving together the intricate interplay between demand and supply.
2. Handle Formation: The Prelude to Anticipation
Following the organic embrace of the cup, the handle formation emerges—an intriguing prelude that tantalizingly hints at the future. This segment assumes the shape of a concise consolidation, often resembling a brief pullback or a tranquil sideways drift. The handle, akin to a contemplative interlude in a symphonic composition, captures a moment of introspection. It's akin to a traveler pausing at a vantage point, surveying the terrain before embarking on the next phase of their journey. During this introspective intermission, market participants recalibrate their strategies, absorbing insights for the forthcoming movement.
Interpreting the Pattern: Guiding Continuation with Finesse
The Cup & Handle pattern serves as a reliable navigational instrument within the ongoing narrative of a trend:
• Bullish Narratives: In an upward trajectory, the Cup & Handle encapsulates the very essence of continuity. It signifies the unwavering persistence of the prevailing uptrend, elegantly supported by the inherent flow of the pattern's organic formation.
Validation Through Breakout and Volume:
• Breakout Confirmation: The core of the Cup & Handle pattern's credibility hinges upon the breakout above the handle's upper boundary, often referred to as the resistance level. This pivotal juncture serves as a luminous beacon, illuminating potential entry points and validating the pattern's existence.
• Volume as a Harmonic Undertone: Volume analysis lends a harmonious undertone to the pattern's melody. Attentive observation of volume trends during the cup and handle stages adds a resonant chord. Heightened volume during the cup formation, followed by a gentle cadence during the handle, amplifies the pattern's authenticity.
•
Projection and Beyond: Navigating the Path Ahead
• Projected Price Targets: Peer into the future by projecting potential price targets above the neck line breakout. The symphony of Fibonacci levels—62%, 79%, 100%, 127%, and 162.7%—composes a harmonious ensemble of potential completion points.
• Harmonizing Analysis: Synthesize your findings with the broader market landscape. Overlay auxiliary technical tools, such as support and resistance levels, to orchestrate a harmonious fusion of analysis and fine-tune your trading decisions,
•
As we voyage further into the intricate domain of technical analysis, the Cup & Handle pattern takes on a persona beyond mere lines on a chart. It becomes a living embodiment of the intricate dialogue between market psychology and the ebb and flow of price dynamics. In your arsenal as a trader, it functions as a steadfast compass, guiding you with its radiant light through the intricate labyrinth of trends. This is your roadmap to navigating the captivating odyssey of continuation.
"Cup & Handle Unveiled: Mastering Continuation Strategies with TCPLTP"


The Cup and Handle Pattern in TradingGreetings, fellow traders and investors of @TradingView 📈🚀
Keep your eye for cup and handle pattern, a chart formation that hints at potential market possibilities.
The Cup and Handle:
Visualize a cup, complete with a 'U' shape and accompanied by a handle. This chart pattern mimics that very shape, capturing price shifts that can hint at noteworthy market movements. Here's the essence: a cup forms through a gradual downward trajectory, leading to a stabilizing phase, and eventually, a rally that mirrors the extent of the initial decline. This sequence of price action is pivotal in identifying the characteristic cup and handle formation.
Initiated by low trading volume, the formation gathers momentum with rising volume as the left lip of the cup takes form. Subsequently, volume recedes near the cup's bottom, only to surge again towards the right lip and breakout.
The initiation involves a dip in price, followed by stabilization, and finally, a rally that aims to retrace the plummet's impact.
As the cup materializes, it curves into a 'U' shape, while the price dips slightly to craft the handle. Notably, the handle must be smaller than the cup and should exhibit a minor downward trend within the trading range. It's imperative that the handle doesn't dip below one-third of the cup's depth.
Strategy and Execution
Now, how can you effectively trade this compelling pattern? The strategy involves positioning a limit buy order just above the upper resistance of the cup and handle. Simultaneously, set a stop-loss order slightly below the handle's support. This calculated approach ensures that your buy order triggers only when the price breaks through the upper resistance level. This cautious measure shields you from premature entry due to false breakouts.
For traders seeking an extra layer of assurance, patiently waiting for the price to conclusively close above the upper trendline of the handle can provide a higher degree of certainty before initiating the trade.
🌟 Wishing you successful trades and profitable outcomes as you leverage insights from @Vestinda. Remember, patience and careful analysis are your allies on trading path.
Happy trading! 💰

UXY 4 Hr 103 Target Cup-Handle PatternUXY 4 Hr 103 Target Cup-Handle Pattern
UXY 4 Hr 101.450 above
101.720 Above candle Close
Activation Cup-Handle Pattern

Cup with handle Bullish pattern having Cup with handle pattern in chart at life time High
May give opportunity to get high levels


Grab a Cup of Coffee We'll Handle ThisA cup and handle formation is a technical pattern that can be found in financial charts. It is considered a bullish pattern, meaning that it may indicate a potential opportunity for a price increase.
The pattern is named after its resemblance to a cup with a handle. The cup portion of the pattern is created when the price of an asset forms a rounded bottom over a period of time, followed by a pullback that forms the handle. The handle is usually a smaller, downward-sloping price movement that retraces a portion of the cup's advance.
Traders often look for a cup and handle formation as a signal that the price of an asset may be poised to break out to the upside. However, it's important to note that technical patterns are not foolproof and should be considered in conjunction with other forms of analysis.
If you have identified a cup and handle formation in a chart and believe it may be an opportunity, it's a good idea to confirm your analysis with other indicators or signals before making any trading decisions. Additionally, it's important to always practice proper risk management and consider factors such as your investment goals, time horizon, and overall market conditions.

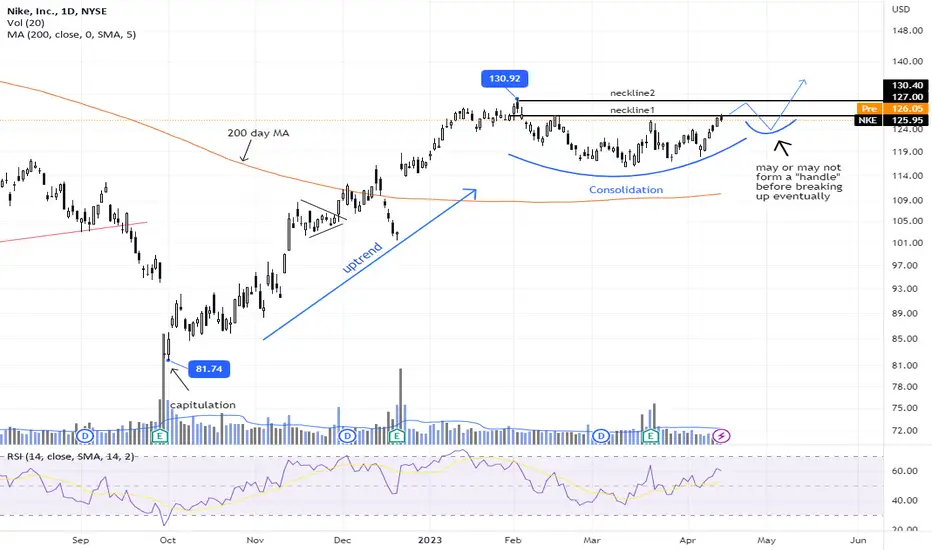
NKE - CUP (& handle?) in the makingA "CUP" formation (with or without the "handle") is usually a consolidation period after the stock has run up.
NKE ran 60% since its capitulation low @ 81.74 on 3rd Oct 2022 to a high of 130.92 on 2nd Feb23 before it began to "consolidate" for the past 2.5 months.
It looks like it could attempt to retest the last high @ 130.92 in the coming days. Once it reaches this level however, whether it would break up soon after or instead begin another smaller consolidation (to form a "handle") remains to be seen. With earnings expected only in late June, it is possible a breakup above 130.92 may not happen so soon.
Those who are invested need to remain patient as the longer term trend is still looking good.
Short term trader would wait for a confirmed breakup of the neckline 2 @ 130.92 to initiate a Long trade.
Disclaimer: Just my 2 cents and not a trade advice. Kindly do your own due diligence and trade according to your own risk tolerance and don't forget that money management is important! Take care and Good Luck!
Inverse Chart: Cup n' Handle - Short LinkThere's an inverted cup/handle on the weekly link/btc chart. I've inverted the chart. Short link vs. bitcoin if we breach and hold beyond the neckline. Measured 1x and 1.5x targets are shown on the chart. Dashed line is 0.5x.
