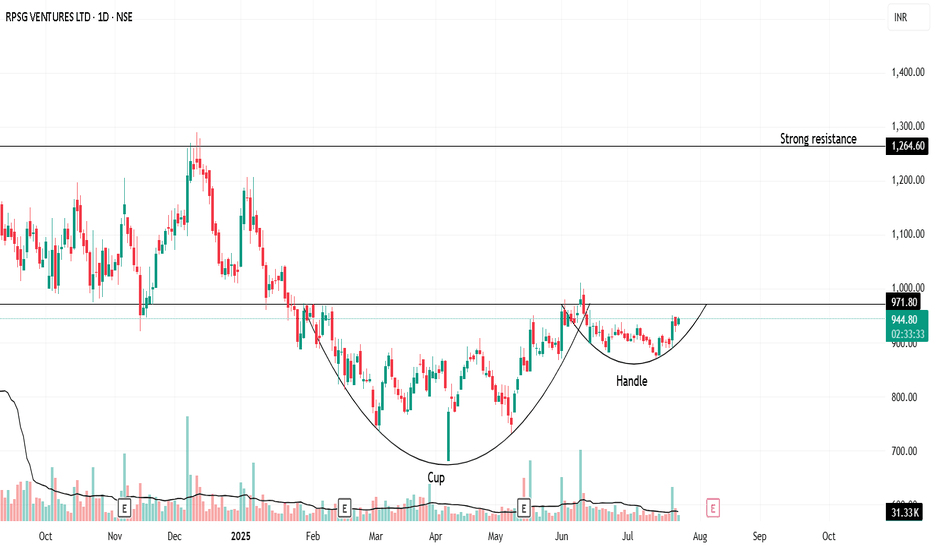
"Handle Tightening… Is RPSG Ready to Explode?"Once upon a trend, RPSG Ventures brewed a picture-perfect Cup & Handle—a structure born not out of coincidence, but crowd psychology and silent accumulation.
After nearly 9 months of consolidation, the stock crafted a deep, symmetrical cup (between November 2024 and May 2025). Traders forgot about it. Volumes dried. Hope faded.
But quietly, the handle formed—short, shallow, and tight. It’s not just a chart pattern—it’s a test of patience. And now, the breakout zone at ₹971.80 is like the rim of a boiling kettle: silent… until the whistle.
🧭 Possible Future?
If it breaks out: A rally toward ₹1,264 isn't just possible—it’s logical.
If it fakes out: Back to base, retest near ₹890.
💬 What makes this unique?
This isn’t just technical analysis. It’s a behavioral pattern. Fear, exhaustion, optimism—they're all baked into this structure. Cup & Handle isn’t bullish because of lines—it's bullish because it reflects crowd hesitation turning into confidence.
🚨 "Spill or Serve?" — comment below .
🧠 Watch the volume.
🛑 Don't jump the gun.
✅ Let the breakout come to you.
📜 Disclaimer:
This is not trading advice—this is pattern psychology in motion. Always consult your financial advisor before making real trades. This story is meant to provoke thought, not profits.
Cupwithahandle
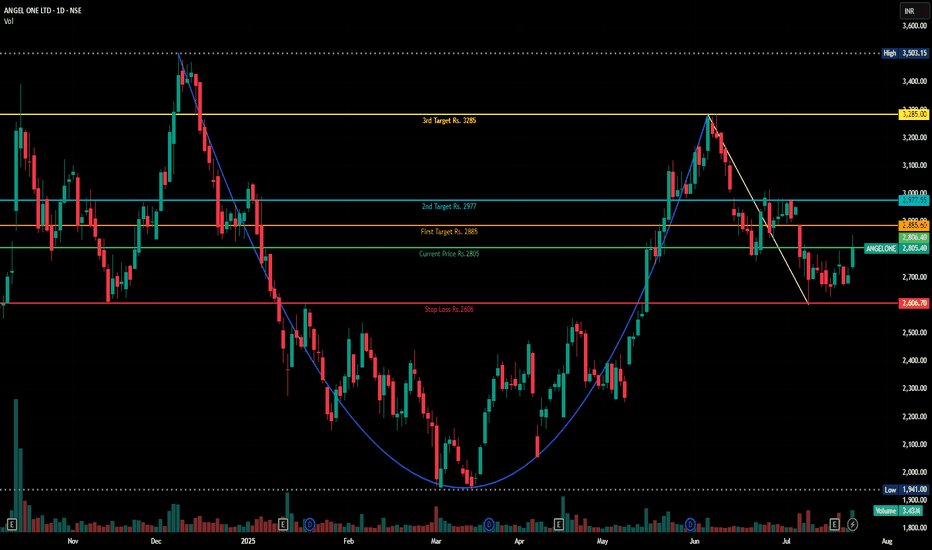
Cup and Handle Formation in Angelone ChartDisclaimer : Do your own research before investing. This is just a chart analysis for education purpose only. No recommendation to buy and sell.
In Dec 2024, AngelOne made high of Rs.3500 and pull back to level of Rs.1941 in March 2025.
After touching level of Rs. 3288 , its now trading at Rs. 2805.
I can see a cup and handle chart pattern formation in this stock. to me , it will be bullish in near to long term.
I have mentioned my targets along with stop loss.
Bullish Cup with Handle🚀 SEED_ALEXDRAYM_SHORTINTEREST2:IO Forming Bullish Cup with Handle – Breakout Potential! 📈
SEED_ALEXDRAYM_SHORTINTEREST2:IO is forming a potential bullish cup with handle pattern! 🧠 If the price breaks the red resistance, the first target could be the green line level! 🔥
Let’s catch this breakout together! 💼💸
IDEA:CUP AND HANDLE FORMATIONThe NSE:IDEA is currently forming a classic Cup and Handle pattern. This bullish continuation pattern suggests a potential upward movement once the pattern completes and breaks out. Here's a detailed breakdown of the pattern and the trading strategy:
1. Cup Formation:
The stock has undergone a rounded bottom, creating the "cup" part of the pattern.
The left side of the cup was formed due to a decline in price, reaching a bottom before rising back up to the original level.
This cup formation indicates a period of consolidation and accumulation, where buyers are gradually gaining control.
2. Handle Formation:
Following the completion of the cup, the stock entered a small consolidation phase, forming the "handle."
The handle typically slopes downward or moves sideways, showing a slight pullback.
This pullback is generally short-term and should not exceed more than one-third of the cup's depth.
3. Breakout Point:
The ideal entry point for traders is the breakout above the handle's resistance level.
Traders should look for a significant increase in volume during the breakout to confirm the move.
Target:
The target price can be determined by measuring the depth of the cup and adding it to the breakout point.
Target Price Calculation:
Target Price: 25
Stop Loss:
Place the stop loss below the lowest point of the handle to protect against a false breakout.
Stop Loss Price: 15.
Disclaimer: This analysis is for informational purposes only and should not be considered as financial advice. Always conduct your own research and consult with a financial advisor before making any trading decisions.
EUR/USD: Bullish - BAT + Cup with handleEUR/USD: Bullish - BAT + Cup with handle
According to the harmonic figures (D/W):
Bearish BAT detected!
the price could go down to 1.07033 / 1.05263 / 1.01124
On the Chartist level:
We are Bullish because in fact, the Wolf of Zurich has detected a cup with a handle or a cup of coffee.
The price could break the polarity zone around 1.12 and reach 1.25649.
The ROC is in divergence territory! And if it enters positive territory, the price can explode higher.
Monitor exponential moving means 50 and 200 in Monthly!!
Indeed, the 200 exponential moving average is around €1.16465.
According to ICHIMOKU (Weeekly):
A return to 1.05153 is possible
Be careful.
Happy trading to all
Cup with handle BO in $NSE:SBILIFE NSE:SBILIFE
Pattern details:
Sideways trend before forming Cup with handle pattern
Cup with ~20% correction and length of cup 26 bars
Handle length is 9 weeks and ~6% correction.
Volume needed to increase the success probability
PAT for the quarter ended 30 June 2023 at 381 cr, 45% growth Y-o-Y
NSE:LEMONTREE 's and NSE:TATAPOWER 's patterns are still in progress
Disc - invested, for educational purposes only
TRONUSD: Logscale AB=CD Looking to Play Out For a 2nd TimeThis is a Cup with Handle and an AB=CD at the same time that I posted before, but it was on the FTX chart and that one actually ended up playing out perfectly but on other exchanges TRXUSD just kinda sat here but now it's breaking out on a Monthly timeframe and it's starting to look like we will be getting the same performance we got on FTX on a more Global level so I'm just reposting it on a chart that's still alive since the FTX chart is gone.
The MACD on the Monthly should also be going into positive territory very soon.
Here is the link to the original setup:
On another note, TRX recently reached the TP target of a more recent daily trend line trade, one could try to hold on for the bigger target presented on the monthly chart, or they could take some profits now given how much they are up. Here's a link to that setup:
ABCL - Cup & Handle Breakout TradeAbcellera Biologics is a biotech stock setting up in a textbook cup with handle pattern.
The stock has growing institutional sponsorship as shown in the chart from MarketSmith on the chart. It also has a relative strength ranking of 97/100.
Shares formed a cup with a 37% depth and have since drifted back slightly to form a defined handle.
I will consider buying on a break above the dashed downtrend line of the handle.
LINKETH: Cup With Handle Above Moving AveragesSo during this market some coins are doing much worse than others and for the time being it seems like ETH is going to be among the next coins to collapse. In the meantime there appears to be alot of opportunity in trading pairs against Ethereum.
In the case of Chainlink we have a Cup With Handle backtesting the top of a Channel and the Moving averages with a Measured Move above 0.01 ETH.
MBAP - CUP WITH HANDLEI got into a full position today on this classic cup and handle pattern.
This is not the environment for a full 25% position, but I see the very constructive price action and fundamentals in the stock.
However, on the closing day, the stock keeps coming down to its breakout level and forces me to reduce my position in half.
AMPS - Cup w/ Handle Breakout BuyAMPS is coming out of a textbook cup with handle pattern, triggering a buy here.
AMPS is somewhat of an under-the-radar solar stock. Unlike most solar companies which make panels, chips, or mounting systems for customer-owned solar energy systems, Altus is an electric utility company whose power comes exclusively from solar generation.
I actually prefer the names that don't already have a million eyeballs on them. EVERYONE is watching ENPH, FSLR and the other big solar names. But AMPS is setting up to be a big mover.
The 200-day moving average is finally turning up, signaling the beginning of the stock's first Stage 2 uptrend. If this is indeed the beginning of a new stage (see my previous post on the 4 Stage of the Stock Cycle), there could be massive upside from here.
Ravencoin Cup With Handle on the Hourly TimeframeRavencoin sits at the 61.8% Rertrace of a Potential Cup With Handle at the PCZ of a Bullish 5-0 with Hidden Bullish Divergence on the RSI. This isn't my most convicted trade ever but i think it's still worth giving decent a shot to see if Raven Can hold this PCZ level, if it does then we could then see Raven make a 200% Retrace to complete the Measured Move of the pattern.
IBIO consolidation and short-long term swing opportunityIBIO is showing some consolidation. Recently stock is up a a decent volume.
looking at a longer time frame chart : double bottom patter - showing strong support line, defined risk level.
cup with hand formation is a very statistically strong consolidation pattern.
for the target price i would use 26.8% Fabonacci retracement level and 38.2% retracement level. AMEX:IBIO
Dalmia Bharat Ltd - Short-term SwingDalmia Bharat Ltd - Short-term Swing
1. Cup with Handle pattern formed.
2. Once it crosses 1640 it will start firing...
3. Target will be 1980 to 2000
4. Between it has a resistance at 1800.
5. If the stocks move downwards, below 1470 we have a stop loss.
6. based on the market condition it will in a positive direction.... fingers crossed...
Note:
1. I’m not a SEBI Registered advisor, my research is personal and for educational purposes only.
2. Always check with your financial advisor and take the trade as per your risk/reward ratio.
3. Follow me for more patterns and like, and share so that we feel it is helpful to many and share more patterns...
RELL Cup w/ Handle - Long TradeRichardson Electrics (RELL) makes components for microwaves, power grids, generators and data display monitors. The stock is a rare sign of strength in an otherwise abysmal market.
RELL is completing a cup with handle pattern that began in January, and the stock is currently just 5% from new all-time highs. The relative strength line has been surging for the last 6 weeks. It now has an RS rating of 98/100 on MarketSmith. In other words, RELL is outperforming 98% of all other stocks.
The volume up/down ratio is a bullish 1.39 and we have seen several high-volume up days over the last few weeks - a good sign that institutions are likely building positions in the stock.
I've also overlaid the fundamentals at the bottom of the chart. As you can see, sales are growing at roughly 30% per quarter and profits are advancing at a triple-digit rate. RELL posted $0.25 EPS in 2021 and analysts are forecasting $0.91 in 2022 - a 264% increase year over year.
I think RELL is a buy here. If you want further confirmation, wait to see if the stock hits 15.70 to make new all-time highs.The stop would be beneath the swing low at 13.35 for a 9% risk on the trade.


