USDCAD Testing D1 200emaOil price continues to rise as US inventories data fell and OPEC remain firmed to cut oil supply. Oil price is correlated to CAD movement so my sentiment is there could be a sign of reversal if market cannot break above 200ema on D1.
Looking to short if H4 retest at 200ema or form a LH and LL to short. FTP to at Fibo R 50.0%
If price break above 200ema this analysis will be invalid.
The reward to risk for this analysis is 5: 1
Currencytrading

Looking to Long EURAUD at Fibo Retracement 61.8Euro dropped last week due to ECB extension of bond purchasing and Spain-Catalonia political uncertainties. Nevertheless, Aussie also dived significantly last week due to weak inflation data.
Based on technical analysis, EURAUD is testing the impulse leg fibo R 61.8. Currently the market is in range and is waiting for more signal to dive lower or reverse. If on H1 it breaks and closed above 1.5137 I will looking for long opportunity, and if it breaks and closed below the 61.8 level, this analysis will be invalid.
The reward to risk for this is 4:1

Symmetrical triangle, a continuation pattern..On the weekly, chart there's a symmetrical triangle, and it's in a downtrend.
It has 6 touches, 3 on either side.
If it goes to plan, the pair should fall lower and break out,
as this is a continuation pattern and not a reversal.

$USDCAD - US Dollar/Canadian Dollar - LongThesis:
The name is trending higher on multiple timeframes along with the USD overall
Confirmation:
1. Higher highs and higher lows on Day and Week charts
2. Above Trendline Support
3. Above 8 Day EMA
4. Above 21 Day EMA
Contradictions
1. Below resistence
Trade:
Long $USDCAD

BTC from an Institutional perspective part 2.This is a follow up of my previous idea.
Now we will take a look at the current volume pattern in BTC on the same time frame.
For my idea to be proven right, I will need to see an influx of selling coupled with this low buy volume.
The past 150 points on BTC has been driven by very little buying as we are seeing a sustained trend that is more like an equity than a crypto.
We shall see if this is just it being bid up before sold off.
Unfortunately I do not have a portfolio manager who will listen to be and execute this. Stupid Volcker act amiright?
This security is definitely tradeable, unfortunately it lacks the transparency and regulation to be mainstream, but the qualities exist to make it worth looking at.
I am always interested in hearing the perspective of other traders and analysts.

Bitcoin trends from an Institutional perspective.Watch the previous obliterations of BTCUSD pricem which I have noted on the chart.
A 10% drop and a 30% drop.
Now correct me if I am wrong but these were more event driven than anything as the wonderful market manipulator (Chinese government) came out and made disparaging remarks about Bitcoin (wonder how much insider shorting or selling happened).
They threatened to close exchanges and not allow crypto to be used in startup company investing.
Now.....put all that aside, and crypto traders. Put aside your charting tools.
Take note of the orange lines I have market on the chart where volume completely disappears.
Gains on no volume always tell me to get ready to hit the sell button or tell the algo to ;) or go ahead with a short.
Both precipitous drops were preceded by this trend in volume which is common across all tradeable asset classes.
(another reason to accept crypto? it is just like the rest of the securities lol)
Btw can people help me get to this 50 reputation points thing? I thought I had a reputation when I logged on here hahaha. Thanks.

EURUSD potential short playIt has been awhile, but I am back to post my next potential chart setup. There is a potential for the downtrend to continue with the euro (nickname fiber) if it closes on the daily chart below the drawn support line. The likelihood will also be based on trading during a time that I don't usually trade, which is during various fundamental announcements, since it is the beginning of the month. Happy Trading

AUDUSD Support current .78317 2Oct17Looking for a Buy Signal on AUDUSD in an Uptrend.
There is support here around .78300 to .78232
Wait for signal for confirmation
Sean Vengan
Professional Trader and Trading Educator
DISCLAIMERS TO VIEWERS OF MY POSTS - PLEASE READ CAREFULLY
1. If you don't agree with my views or analysis and looking to just be mischievous, it's very simple, FOLLOW SOMEONE ELSE
2. I am not here to give you financial advice and if you take a trade it is YOUR FULL RESPONSIBILITY, not mine.
3. I am not your Professional Trading Mentor or here to provide you with a Free Professional Trading Advisory Service.
4. I am not obliged to provide analysis, commentary or answer any of your questions. I am here to trade for my sole benefit, not for your benefit.
5. I am a paid member, not a free member, so I am on Trading Views to use their paid services. My presence on TV is not to provide you with analysis.
6. I am happy to help you in your trading if I choose to and I feel you are being courtesy. It is my free choice to answer you, I am not obliged to.
7. If I provide and give up MY VALUABLE TIME providing analysis to you please respect that I am providing it FREE of charge. Appreciate it and don't take it for granted.
8. If you comment to me, simply be courteous and we can show each other mutual respect. If you are rude or disrespectful I will ignore you or send you a curt reply.
9. If you are abusive I will report you and will leave it to the moderators to decide if you should be banned.
10. If you don't like my views eg If I think Bitcoin is going up and you think it is going down, then please do not abuse me just for having opposing view to you. Show us all your analysis, don't hide behind rude comments and alias name. Lack of analysis shows lack of knowledge and experience.
11. I have no issue with you expressing your opinion or disagreeing with my views but please DON'T DISRESPECT me or other traders or write personal comments, this is offensive.
12. I have over 10years+ solid Trading Experience. I do not need to justify myself to you my knowledge and experience, my analysis and commentary demonstrate my skills and expertise.

USDEUR Short current 0.8477 2Oct17A pullback on the US Dollar has given as an opportunity to short.
Risk Reward 2.87:1
Sean Vengan
Professional Trader and Trading Educator
DISCLAIMERS TO VIEWERS OF MY POSTS - PLEASE READ CAREFULLY
1. If you don't agree with my views or analysis and looking to just be mischievous, it's very simple, FOLLOW SOMEONE ELSE
2. I am not here to give you financial advice and if you take a trade it is YOUR FULL RESPONSIBILITY, not mine.
3. I am not your Professional Trading Mentor or here to provide you with a Free Professional Trading Advisory Service.
4. I am not obliged to provide analysis, commentary or answer any of your questions. I am here to trade for my sole benefit, not for your benefit.
5. I am a paid member, not a free member, so I am on Trading Views to use their paid services. My presence on TV is not to provide you with analysis.
6. I am happy to help you in your trading if I choose to and I feel you are being courtesy. It is my free choice to answer you, I am not obliged to.
7. If I provide and give up MY VALUABLE TIME providing analysis to you please respect that I am providing it FREE of charge. Appreciate it and don't take it for granted.
8. If you comment to me, simply be courteous and we can show each other mutual respect. If you are rude or disrespectful I will ignore you or send you a curt reply.
9. If you are abusive I will report you and will leave it to the moderators to decide if you should be banned.
10. If you don't like my views eg If I think Bitcoin is going up and you think it is going down, then please do not abuse me just for having opposing view to you. Show us all your analysis, don't hide behind rude comments and alias name. Lack of analysis shows lack of knowledge and experience.
11. I have no issue with you expressing your opinion or disagreeing with my views but please DON'T DISRESPECT me or other traders or write personal comments, this is offensive.
12. I have over 10years+ solid Trading Experience. I do not need to justify myself to you my knowledge and experience, my analysis and commentary demonstrate my skills and expertise.


EURGBP: Tumbles, Continues To Retain Its Downside PressureEURGBP- The cross continues to hold on to its downside pressure selling off on Thursday and opening the door for more weakness. Support lies at the 0.8850 level where a violation will turn focus to the 0.8800 level. A break will expose the 0.8850 level. Resistance resides at the 0.8900 level where a violation if seen will turn risk towards the 0.8950 level. Further up, resistance resides at 0.9000 level followed by the 0.9050 level. Its daily RSI is bearish and pointing lower suggesting more weakness. All in all, EURGBP remains biased to the downside on further weakness

USD/JPY (Short-Term-Trade) - Market Update Could we see a possible down-side for USD/JPY? Previously we have seen that price went into a small bullish trend. As you can see it didn't go too far; as it rejected our Major Trend-Line. That area was a extreme critical area as it aligned with a Major 38.6% Fibo area.
What do I need for a entry? If we manage to see price closing -BELOW- our Minor Trend-Line I will be placing a -SELL- a good area of T/P would be our Weekly Support as well as our Previous -27.20% Fibo area. We have a few T/P extensions that are not shown above.
Regarding a upside movement we are kinda far away from one as of right now. We would need price to close -ABOVE- our major trend-line so we can continue a upside movement. But at least for now I don't see that happening.
*This is NOT a signal, for any specific pair review please send me a message or email me at TheForexClubFX@gmail.com
*We also have a special promotion until the end of next week for our Advance Training that you wouldn't want to miss out!

XAU/USD (Short-Term-Trade) Aggressive Entry We are placing a -SELL- on gold as we saw that price has closed below our Minor trend-line. Now we are placing a pretty aggressive entry. When the 4H candle closes if it closes -BELOW- our Trend-Line as well; we will place another entry with a bigger lot size. Analysis was posted on our free telegram.
*This is NOT a signal.
For inquiries on our Advance training please email us at TheForexClubFX@gmail.com

EUR/GBP (Short-Term-Trade)We have seen a minor pull-back. Price has broken our Minor Trend-Line and I can see a down-trend. We have already placed a -SELL- for a Medium-Term-Trade this is just an extra entry.
Our T/P is going to be set to our -27.20% but we may extend it later on.
*This is NOT a signal.
For inquiries on our advance training please email us at TheForexClubFX@gmail.com

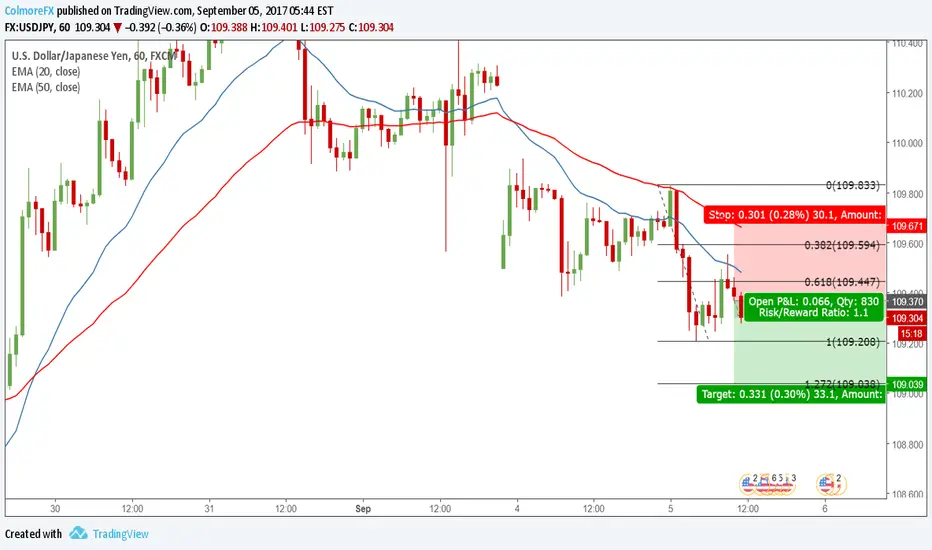
USDJPY SHORT TRADE Currently short USDJPY as the risk off scenario looks to continue with geo-political tensions growing between the US and North Korea we are seeing safe haven currencies and commodities appreciating.
Watching the 1HR charts we can see that price has respected the dynamic resistance of the 20EMA and created a C2 close off a 61.8 Fibonacci retracement.
$514 targetResistance became support at $206
and ETH is still bullish.
It has every chance to get to $514, but
in this market, fortune only favours the brave,
and sometimes they get wiped out.

STRATIS on alert for a long opportunity Looking for Stratis to bounce here providing us with a long trigger. We have potential support both on the base of the Ichimoku cloud and a trendline
Note there is no signal yet, so therefore no entry yet but stay Alert.
Another very low risk High Reward POTENTIAL setup.
Be patient - wait for SIGNAL.
Hope this helps.
Sean Vengan
Professional Cryptocurrency Trader and Trading Educator

Big pips either directionAs we go into the end of the month and ultimately into August, the infamous low volume month, I will be looking for two things on this pair. GBPJPY will likely get choppy but not like the rest, it can move so much more than other "normal" pairs.
Pretty simple set up here:
1. Sell break of 144.90 targeting 144.00
2. Wait for a push higher and look for a break of 148.00 or rejection off that level.
If 144.90 area breaks sooner than later, that should be an easy 100 pips, otherwise it turns into a bigger waiting game.


USD/JPY continues the downtrendThe US dollar showed more weakness yesterday as it fell down towards our projected 1.27 Fibonacci extension (~112) from it's previous leg down (113.6 - 112.26) and managed to bounce back up from there towards the 0.38 Fibonacci retracement level, waiting for more downside as it couldn't break it.

AUDCHFThis is kind of a tricky trade. I am waiting to see if AUDCHF breaks the top trend line if not what i expect will happen is it will fall to the bottom trend line and break it.

Breakout from rectangle patternAfter Draghi's comments, could EUR/GBP be breaking out of its rectangle pattern?

Swing tradeThe asset will have hit the 100 MA so in the short-term will most likely fall, or it could actually break 100 MA, which will make it a definite buy, but till then it will mostly fall then reach support and then rise to hit trendline- swing trade.
