Currencytrading

Nzd/usd short term swing trade Hello traders Nzd/usd has possible upside higher time frame suggests bullish condition we have seen sharp move up breaking 0.64680 institutional level and the market dropped 0.61420 to buy at a good price . price comes at that area to buy more price love that level we can target to fill up the void this can take sometimes or faster depending on how fast they want to get to the level we need to get that pull back . we just have to be patient .

CADJPY: The 1D MA50 is crucialCSDJPY is on the rising Channel of its medium term Channel Up, rebounding on the 1D MA50. The 1D technicals are neutral (RSI = 53.031, MACD = 0.270, ADX = 28.072) and that always favors technically the dominant trend. So as long as the price is inside the rising Channel, our target will be the 1D MA200 (TP = 101.350). If a candle closes under the rising Channel and ideally the 1D MA50 as well, we will sell targeting the bottom of the Channel Up (TP = 96.000).
The 1D RSI is on a HL trendline. Technically a low risk buy will be on that line.
## If you like our free content follow our profile to get more daily ideas. ##
## Comments and likes are greatly appreciated. ##

Forex Update: EURUSD struggling at resistance with ECB to comeToday's focus EURUSD
Pattern – Resistance stall
Possible targets – 1.1165 Upside 1.0965 downside
Support –
Resistance – 1.1065
Indicator support – ECB meeting MA slope up
With the ECB to come, we are focusing on the EURUSD as price continues to be held at 1.1065 resistance. Price has continued to trade in an up trend but, for now, remains held back at resistance that started in April.
The ECB could be a short-term catalyst tonight. Rates are expected to be increased by 25 points. The talk is that the ECB could step back as core inflation slowed to 5.6%, and the inflation figure sits at 7%. A larger-than-expected credit drop and tighter leading criteria are other factors that could maintain the trend of small hikes. Another 25-point hike is forecast for June.
Another possibility could be a reduction in the balance sheet. QT has already been happening with a reduction in the massive bond holdings.
Price-wise, we will need something positive from the ECB to drive the EURUSD higher. Price continues to weaken at resistance, and the USD, another factor, continues to firm today. If the ECB confirms that rates may not rise as much as expected, it could push the EURUSD lower, maintaining resistance. If we see a hawkish surprise in the statement, this could be enough for price to break resistance and start a new leg higher.
Don't forget about the USD and tomorrow's NFP. The USD is holding above 100.80 support, and if it can form a solid comeback with a more dovish ECB could set the EURUSD up for a leg lower.
Thanks for stopping by. Good trading, and have a great day.

Forex Update: AUDCHF continuation watch.Today's focus AUDCHF
Pattern – LH - Continuation
Possible targets – .5920 .5875
Support – .5951
Resistance – .5875
Indicator support – MA sloping down, CCI 0 Cross
Hi and welcome to today’s update. Today we are watching the AUDCHF and wondering if we will see a new continuation lower that will maintain the current downtrend. Yesterday buyers made a solid move after the RBA rate hike but the move was cut down through the US session. We have run over the triggers we are looking for to confirm our continuation idea and watch to watch out for what could invalidate this idea.
Another factor could be tomorrow morning’s FOMC. If this ends up giving the AUD a boost it could invalidate the the signs we are seeing currently. The FOMC will be released at 4:00 am AEST Thursday morning.
Thanks for stopping by. Good trading, and have a great day.


GBPUSD Outlook for the Week AheadThe GBP/USD currency pair has recently seen bullish pressure take control, with bears unable to invalidate the crucial demand/support zone at 1.23823. Over the past two weeks, the 1.25044 supply/resistance level has successfully held, prompting the question: what's next for the GBP/USD pair? To answer this, we'll analyze the daily, 4-hour, and 1-hour candlestick charts.
The daily chart reveals a significant supply/resistance level at 1.26080, near the psychological 1.26000 price level. The bullish trend is evident as long as the 1.25044 level holds, with the price above the 20-day EMA and MACD zero level. Should the 1.25000 zone fail to hold the price, a push down to the nearest demand/support zone at 1.21821 is expected.
Similar bullish trends are observed in the 4-hour and 1-hour charts, with the price trading above the 20-period EMA and MACD zero level. The multiple timeframes support the uptrend, with the next week's price movements being closely watched.
However, the technical outlook for GBP/USD remains uncertain, with market sentiment being the key driver. The range between 1.2350 and 1.2550 offers potential range-bound opportunities, with a daily candle close above or below the range top or bottom being key for bullish continuation or a deeper correction to the downside. Retail traders are currently short on GBP/USD, but a contrarian view suggests a short-term bullish bias.
While no major news is expected for the GBP next week, the USD has several high-impact news events, such as the ISM Manufacturing PMI, JOLTS Job Openings, ADP Non-Farm Employment Change, FOMC Statement, Federal Funds Rate, and Unemployment Rate, among others. These events could potentially affect the GBP/USD pair, making it essential to monitor technical indicators and upcoming news to identify potential shifts in market sentiment.

Is USDCHF going to tests it's weekly high again?Hello Traders , I'm sharing my game-plan of USDCHF for the coming weeks.
There is the bullish XABCD Pattern on weekly chart frame. And on the Daily or 4Hr time frame, it took rejection from the strong support zone . There's also a bullish divergence on 4hr time frame on key-levels.
I'm strongly bullish on this pair, in coming few weeks, This pair will be going to test the weekly high once again.
Trade Safely.

EURUSD: Hit the 4H MA100 and is rebounding.EURUSD is trading inside a Channel Up that is holding for more than 1 month. The neutral 1D technicals (RSI = 55.804, MACD = 0.006, ADX = 27.998) indicate that this is the ideal short term buy entry. The 4H RSI also shows that yesterday's Low may be the same as April 10th. As long as the price is closing inside the Channel Up, we remain long, targeting the 1.618 Fibonacci (TP = 1.11750). A closing under the Channel targets first S1 and the 4H MA200 (TP = 1.09100) and if extended then S2 and the 1D MA50 (T{ = 1.08330).
Prior idea:
## If you like our free content follow our profile to get more daily ideas. ##
## Comments and likes are greatly appreciated. ##

Will GBP/JPY head higher?A quick video on how the GBP may strengthen against the JPY.
Looking bullish and may breakout from 172.
Trade your own plan, do your own research and good luck!

DXY - US Dollar should riseWe've just had a decent pullback and now we could get the bounce.
The US fiscal flows have gone into surplus. What does that mean? It means the US Treasury is taking more out of the system than they put in. This means they are taxing more than they are spending.
When a government taxes they destroy the currency. This means there are fewer dollars in the system than in March and we could go back to the Late September levels. Fewer greenbacks in the system could mean the scarcity effect increases what people are willing to pay. There is also the coming rate hike in a couple of weeks' time.

EURUSD 25/04/2023 UPDATEHi Traders!
Our EURUSD idea on the 25/04/2023 was absolutely smashed, which resulted in a fantastic risk to reward setup. We reached the price target of 1.10760 before retracing around the 1.0956 level which is the now the new resistance.
There was a further push to the downside and we are now ranging looking for direction, trading opportunities will come soon and will post as soon we find any. Make sure you stay tuned!
As always, your support is greatly appreciated!
BluetonaFX

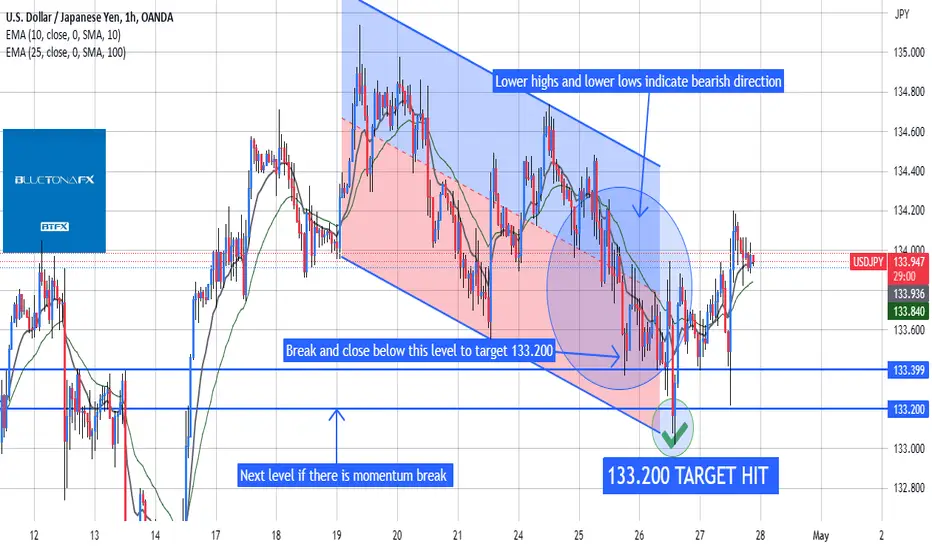
USDJPY 26/04/2023 UPDATE Hi Traders!
We hit the 133.200 price target on the bearish trading idea on 26/04/2023.
There was a further push to the downside before bouncing off support near the 133.000 level with opportunities for other entries in the near future.
Please remember to follow, like and comment, there will be plenty more to come from us over the next few weeks - your support is greatly appreciated!
BluetonaFX
EURJPY buyers setting up for a new push higher? Today's focus EURJPY (EURUSD & GBPUSD)
Pattern – trend continuation
Possible targets – 148.30 – 148.65
Support – 146.65
Resistance – 148.30
Indicator support – hard sloping EMA, 0 line dip and break.
Looking at the EURJPY, we can see that buyers have started to set up a new continuation pattern after yesterday's fightback buyers have set new highs today but still remain below Tuesday's selloff. Yesterday's fightback bounced off 146.65 and reconfirmed that level as support. We want to see buyers continue to push higher today and hopefully retest 148.30. At a minimum, I'd like to see price close above yesterday's high.
The EMA remains on a firm upward slope, supporting buyer momentum. The CCI has dipped and moved back above the 0 line, a solid sign that supports a continuation. Indicators only support a set-up they can't predict. If price reverses, this could change their current display.
This pattern is not just seen on the E/J. We have also looked at the EURUSD and GBPUSD in the video, as they are also showing a similar pattern. Those two markets also have resistance and ranges to beat to confirm their continuations with a breakout.
Thanks for stopping by. Good trading, and have a great day.

BluetonaFX - USDJPY 1H Chart Trade IdeaHi Traders!
We currently have a bearish channel with potential target of 133.200 we must have a momentum break and close of the 133.399 level to see this.
Bearish bias is also shown in the price action with lower highs and lower lows.
Please remember to follow, like and comment, there will be plenty more to come from us over the next few weeks - your support is greatly appreciated!
BluetonaFX

Gbpusd golden pound setuphello traders we see pound breaking 4hr zone we see also commercials position are in a bear mode .we can clearly see we are making a descending triangle wait for the break and candle close on a 15 min lets make some pips

BluetonaFX - EURUSD 1H Chart Trade IdeaHi Traders!
We had a breakout of the short term resistance level of 1.10004 which then led to a pullback around the 1.10671 level as the market tried to re-test the main resistance level of 1.10760 which made a double top formation.
If the market stays below 1.10671 we are likely to see a re-test of 1.10004 as support with the 100 moving average also near that level at 1.09983, any breaks above 1.10671 we are likely to see another re-test of the main resistance at 1.10760 and if that breaks, there is potential of a further push to the 1.11000 level.
Please don't forget follow, like and comment, there will be plenty more to come from us over the next few days and weeks - your support is greatly appreciated!
BluetonaFX

EURUSD Bullish Breakout Targeting 1.1690 Amid Positive SentimentThe EUR/USD currency pair is displaying a strong bullish trend, fueled by the potential ECB interest rate hike and a weakening US dollar ahead of key economic data releases. With a decisive break above the key resistance level of 1.1035, the pair is poised to target 1.1690 as the next major milestone. Keep an eye on upcoming data and events for further validation of this bullish outlook.

Can the USDJPY get the trend back in play?Today's focus USDJPY Daily Chart
Pattern Support hold/trend continuation
Possible targets – 134.95 – 137.35
Support -133.90 – 133.70
Resistance –134.70 – 134.95
Indicator support – Price above MA with upslope CCI above 0 line
Will today's push higher turn into something more on the USDJPY? Buyers so far have set the tone with a 0.42% rally to today's high. Some selling has taken hold in the last hour, but if buyers can hold the move, we are looking for a new move to test resistance, and if that area can be beaten, we could see a new move to 137.35 if a new trend continuation is confirmed.
Support remains at 133.90. If sellers cut down today's move and break support, then this idea is nullified for now! We need to see support hold and preferably a solid finish on today's candle.
The BOJ meets this Friday, and questions remain about policy regarding bond yields. Keep an eye on this, as we have seen some volatile meetings previously.
Will we finally see a break of resistance after last week's latest hold?
Thanks for stopping by. Good trading, and have a great day.

Dxy weekly forecast us dollar Hello traders i did a dxy analysis helps to have an idea on other basket of currency all are baked by the us dollar .monitoring dxy is one of the tool you can use in your trading . if you find it helpful like and follow for more like this

EURUSD: Strong pullback if this level breaksThe EURUSD pair is trading inside a Channel Up with the 4H MA100 supporting right on its bottom and the 4H technicals neutral (RSI = 53.201, MACD = 0.000, ADX = 21.383) due to a consolidation channel around the 4H MA50.
If the 4H closes a candle over the channel, we will buy the breakout and target the R1 (TP = 1.10750). If however it closes under the Channel Up, we expect a strong pullback either on S1 and the 4H MA200 or the S2 and the 1D MA50. In these cases the target will also be 1.10750. Most accurate buy signal given by the 4H RSI at the bottom of its Channel Down.
Prior idea:
## If you like our free content follow our profile to get more daily ideas. ##
## Comments and likes are greatly appreciated. ##

EURJPY: Pull-back expected. Buy on the 1D MA50.The EURJPY pair has hit the 147.750 Resistance after a strong rally that started a month ago at the bottom of the 1 year Channel Up. The key 1D technicals are firmly bullish (RSI = 65.143, MACD = 1.070, ADX = 55.694) suggesting a strong green trend but as the price is approaching the HH trendline, the greater the probability becomes for a 1D MA50 pullback. This is in line with the previous two bullish waves to the top of the Channel Up.
Consequently, we expect a pull-back here or slightly higher and will be looking to buy on the 1D MA50. The target can be quite high but we will settle with a TP = 150.000.
## If you like our free content follow our profile to get more daily ideas. ##
## Comments and likes are greatly appreciated. ##

NZDUSD: Inverse Head and Shoulders. Excellent buy.The NZDUSD pair is under the 1D MA50, in marginally bearish 1D technicals (RSI = 44.978, MACD = -0.001, ADX = 16.625) but over the 1D MA200 and with S1 just below it. However the long term pattern emerges as an Inverse Head and Shoulders, a technically bullish formation that shapes market bottoms. Consequently, this is a buy opportunity for us targeting R1 (TP = 0.65400) on the medium term.
## If you like our free content follow our profile to get more daily ideas. ##
## Comments and likes are greatly appreciated. ##
