NZD/CHF sell setup 70 pipswe clearly see price is heading to the downside, price action respecting the daily timeframe and fib level of 50% and as we mark down in lower timeframe we clearly see price is respecting the resistance and nice momentum to downside
Nice risk to reward
Follow me more update
Currencytrading

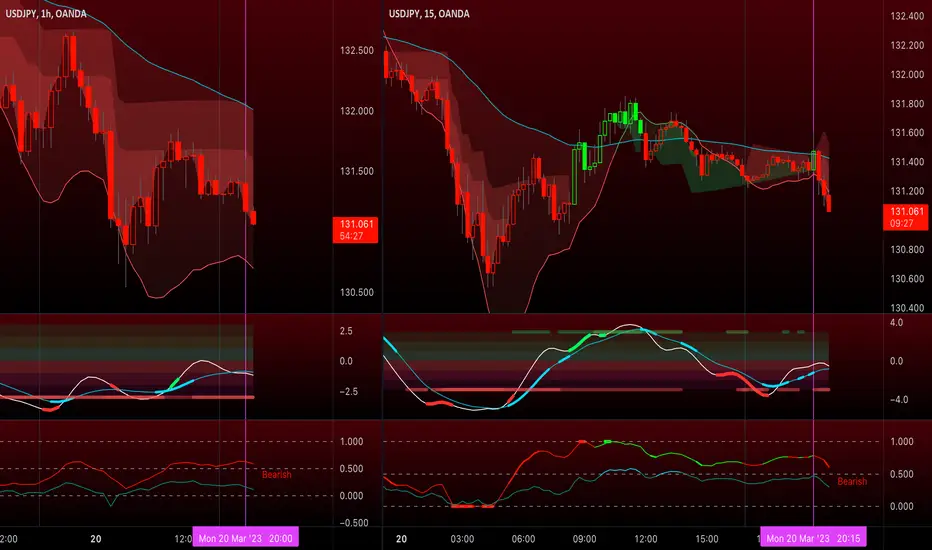
USDJPY signs that could point at a new push higher. Hi, thanks for taking a look at today's update. Today we are looking at the USDJPY as it's a good example of multiple signs that could show a new push higher. Sometimes the more evidence you have to back up an idea, the better. Sadly, that won't be a guarantee it will work out!
The majors continue to see a sold session to the JPY today. The GBPJPY posting a break above resistance and outside of its downtrend.
Looking at the USDJPY, a few things have our attention today that could be pointing to a new push higher. First, we can see classic divergence on the CCI, and we like to see price confirm the divergence as it can give false signals on its own. We also see price breaking minor resistance and the downtrend with a nice false low on the 24th, combined with support at 130.50/60.
All of these together give us lots of ammo that buyers could regain control. What we need now is a nice push higher that gives us confirmation. If buyers continue to hold momentum, we will look at 132.52 and 134.50 as resistance.
If today’s bar fails and we see a close below 131.55 minor resistance, this could be a warning and could be telling us buyers don’t hold the numbers yet.
Let us know your thoughts and good trading.

EURUSD Channel Up pushing to the two ResistancesEURUSD is trading inside a Channel Up pattern that is supported by the MA50 (4h).
Following a Golden Cross, this trend is expected to continue to a Higher High.
Trading Plan:
1. Buy as long as the MA50 (4h) holds.
2. Buy again if Target 1 is hit and the price pulls back to the MA50 (4h).
Targets:
1. 1.09300 (Resistance 1).
2. 1.10325 (Resistance 2).
Tips:
1. The RSI (4h) is on a Rising Support for a whole month. Strong indication of a bullish trend.
2. The Golden Cross is on a symmetry with February's Death Cross. Strong indication that the Resistance (2) gap will be filled.
Please like, follow and comment!!
Notes:
This is a continuation of this trading plan:

USD/JPY - Is it Monday Yet?OANDA:USDJPY
Friday is half over as we come down to London close soon.
I always view multi time frames for my view on the days action.
Trade well

USDJPY January's Support is being testedThe USDJPY pair is testing the Rising Support from the January 15th Low for the first time since the February 2nd Low.
This is a standard case of breakout trading.
The price has been under the MA50 (4h) for 2 weeks.
Trading Plan:
1. Buy as long as the Rising Support holds.
2. Sell if the Rising Support breaks (i.e. closes a candle under it).
Targets:
1. 134.000 (Fibonacci 0.5 and MA200 (4h)).
2. 127.500 (Support (1)).
Tips:
1. The RSI (4h) is consolidating for the past 10 days. This shows loss of strength on the current trend, which means that a rebound might have a slight edge at the moment.
Please like, follow and comment!!

🌟💹 Unleash Stellar Gains with EUR/USD Long Trade Opportunity! EUR/USD pair! 🌊 Our in-depth analysis has identified a superb entry point, offering traders an excellent opportunity to capitalize on market momentum. 💪📈
With a clear take profit and stop loss in place, you can confidently manage your risk while aiming for attractive returns. Don't miss out on this golden chance to boost your portfolio – join us and experience the thrill of Forex trading success! 🚀💰
🔥 Trade Details: 🔥
🎯 Entry Price: 1.08742
🏆 Take Profit: 1.09830
🛑 Stop Loss: 1.07999
💎 Potential Profit: 109 pips
⚠️ Risk Disclaimer: Always perform your own analysis and consult with a professional before making any financial decisions. Trading in the Forex market carries risks, and this signal should not be considered as financial advice. Invest responsibly! 📚🧠

EURUSD broke into long term bullish territory againOur upper target for EURUSD has been hit and now a new trend is emerging.
The price almost touched Fibonacci 0.786 during the Fed today and is retracing.
We are expecting a test of the 1day MA50, which is inside the volatile Support Zone A.
Buy, if by the time of the test the 1day RSI also touches its MA.
Target 1.10250 (Resistance B).
Previous chart:
Follow us, like the idea and leave a comment below!!

Panning for GOLDOANDA:XAUUSD
Who dares to pan for Gold?
Trade smart or don't trade and wait for Chair JP tomorrow.

USD/JPYOANDA:USDJPY
Here is my favorite pair, didn't look too hot today, markets ranging in re-set mode for tomorrow.
Trade well

USD Index, looking to move lower? USD Index, could we have a new leg lower, kicking off traders? Yesterday we saw a third straight decline as sellers rejected an earlier move and took back control. It was a commanding move lower as we saw sellers break and close below 103.35.
This move also beat 103.48 support and set a new lower low after the trend break. This move maintains the run of lower highs and lower lows after the trend break. This can be called normal trend. Price looks to breaking the last uptrend, but we do see some potential support at 103.05 to 102.85. There’s been plenty of demand in that area, and we wonder if price can retest it will we see new demand develop from buyers?
This week’s FOMC is another big factor for the USD. Rates are expected to rise by a further 25 points, but could we see the Fed soften its stance due to the ongoing banking crisis? Inflation remains above their preferred level, so could and pullback, if seen only, be on a very short term?
If we see sellers break yesterday’s low, we will be looking for sellers to make a new test of demand, as mentioned above. Then our focus will be on the FOMC meeting from the 21st to the 22nd of this week, and the statement is a key point of interest.
Good trading.

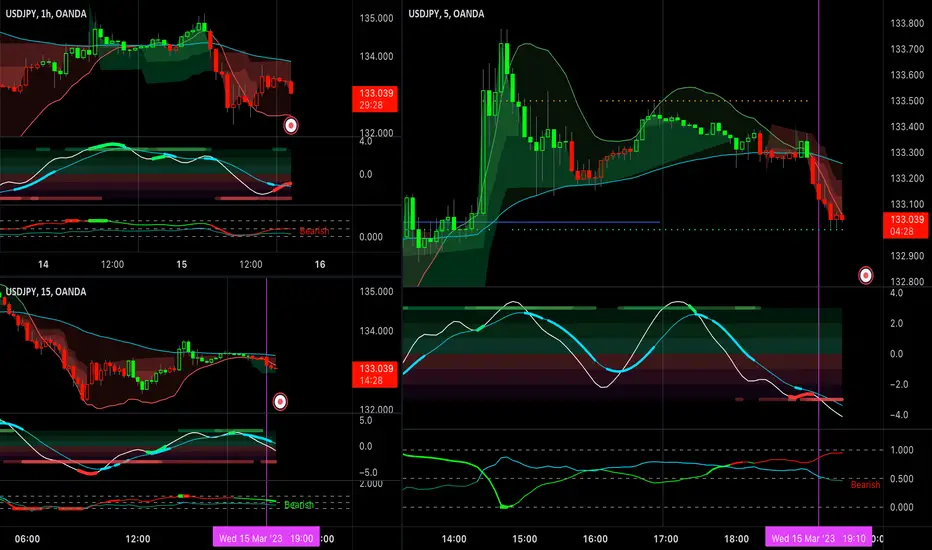
USD/JPY - Finally Got One after Big New York Goose EggOANDA:USDJPY
This time, hard 30 pips TP (131.497-131.195)
Faded this short on the 15m going with the 1H bias, after Asian FX open.
Trade well
USD/JPY - No News? OANDA:USDJPY
Be careful of what we ish for.
We all hate trading news days, but those are the days we get price action pushes one way or the other.
Today?
I wanted and prepared for a short after NYSE open, never triggered, only long plays which I didn't take early on.
OH well, NO NEWS days typically chops in boredom last half of London and into NY.
Trade smart

EURGBP - A Whole Lot of NothingOANDA:EURGBP
NOTHING
Right direction for a short on this pair, BUT after 4 hours of NOTHING, closed at +1pip TP
Pathetically slow day today, waste, should had turned off the power and save on the power bill, LOL

US Dollar Index - ArrgghhTVC:DXY
What a mess.
With the mid tier banking institutions surprise balance sheet news this week; and still continues with new names coming out from hiding, we have the Euro ECB rate chatter.
All this makes the dollar index floundering around and looking for a direction.
Trade management, if your watching the DXY for any confluence in the pairs your trading.
Trade well

Heading into JPY Balance of Trade Release - Short ScalpOANDA:USDJPY
Heading into another high impact news release out of Japan, the Balance of Trade, I took a short scalp of 10 pips hard TP with tight stop loss at this hour.
This scalp took about 10 minutes.
Nice to have a few easy ones in the books.
Now we sit on the sidelines and wait for price action after this news release to settle in.
Trade smart
Trade well
AUDJPY: Buy opportunity on a 10 month Support.The AUDJPY pair hit S1 (87.350), which is a Support level that is holding for 10 months. With the 1D time frame turning momentarily oversold (RSI = 32.308, MACD = -0.610, ADX = 52.239), we regards this as a strong long term buy opportunity. TP = 92.000, some points lower than R1, as the 1D MA200 may be lowered by the time it rises to that point, and it has caused the last rejection on February 15th.
## If you like our free content follow our profile to get more daily ideas. ##
## Comments and likes are greatly appreciated. ##

GBPUSD Pullback on a Support Zones expected. 1.2400 upside targeThe GBPUSD pair hit Resistance Zone A and is consolidating. Sign of selling accumulation.
The 4hour RSI is on the Overbought limit, therefore a pullback is expected to normalize this effect.
Support Zone A is the strongest call as the 4hour MA50 will also enter it by tomorrow.
Buy and set a long term Target at 1.2400.
Follow us, like the idea and leave a comment below!!

My current plan_Focus in on the NZDHere is my current plan I am implementing. I am in a 30k position on the NZD and I looking at continuing to building until 100k. If I could get into my full position before price breaks above the 0.63 lvl, I think I'll be in a good spot. Since the CPI came out as expected, this might be able to give price a little momentum higher. If price is able to hit the 0.65, I would be able to place a stop around 0.62/0.63 and ride price higher (to 0.70, will hit this level, possible in the end of the 2nd QTR). For the EUR I am just using it as a hedge. I ad a 15k position on it, but have recently exited my position. My NZDUSD position recovered and the EURUSD was just used to hedge my position. If the NZD drops again, I'll likely add a 30k position on the EURUSD. Once I am done with the NZDUSD, I am looking to get into the GBPCAD. I am going to wait until price hits 1.70. If it does, I'll start building on that pair slowly. I am looking to build a 400k/500k position, because I am still on the side that price will break down lower and possibly be able to hit the 1.35 level. This might happen towards the end of the 3rd QTR, possibly in the 4th QTR. The reason being is the UK economy is struggling to keep going. Out of all the G7 countries, the economy of UK is pretty bad. I am still looking at the 1.20 lvl and if price is able to actually break that level, and last a week below it, the move lower will actually be on. Now after these, I think central banks will be done raising rates in the end of the 3rd QTR, they might hold on rates, but I think sometime in 2024, banks might start lowering rates. I am thinking that before then, Silver will likely be around 18 or lower, and I would want to build a decent sized position. For now, I am in the first part of this plan and I'll be updating along the way.
This is my plan and how I trade. This is conveying my thoughts and of course this had a ton of risk. For one, I am hedging and I have experienced where both pairs I am in, divergence against me, and I lost money on both. I also use metal stops a lot, which if I don't catch it (which has also happened to me), can move against me hundreds of pips and that would not be a good day. I am just sharing how I trade and hopefully this helps provide some insight to other traders trading styles.
Now that I think about, from writing the above paragraph, for my risk management, this is what I am going to do. For the NZDUSD, like I typed up above, I will use the EURUSD as a hedge. It isn't a natural hedge, but it does work as a good hedge (and has positive rollover on the short side). I will get into this pair at 2:1 (NZDUSD/EURUSD) ratio. I'll be utilizing a hard stop on the NZD if price hits 1.65 (I'll place the stop at 0.62). If price is able to hit 0.67 and I have a full position, I'll move my stop to 0.6450. If I am skeptical or I want price more room to move, I'll identify a natural hedge (possibly the GBP or GBPCAD) and start building a position on both pairs also. Since I think price is going to push lower on these pairs, I'll be able to hold them even if price goes against me (that would my NZD position would be in my favor). I could also scale out also.
Ok, I am done now.
Y'all have some good trading out there.

USD/JPY - Why do I come back to UJ all the Time?OANDA:USDJPY
UJ pair has always been good to me, sometimes a pain, but in general, it has been kind to me.
Might me slow and boring, but safe for me.
Short scalp 10pip hard TP
Trade well

GBP/JPY Buy setup 460 pipsCheck the video to get understanding on my view on GJ this week
Follow and comment below for other breakdowns

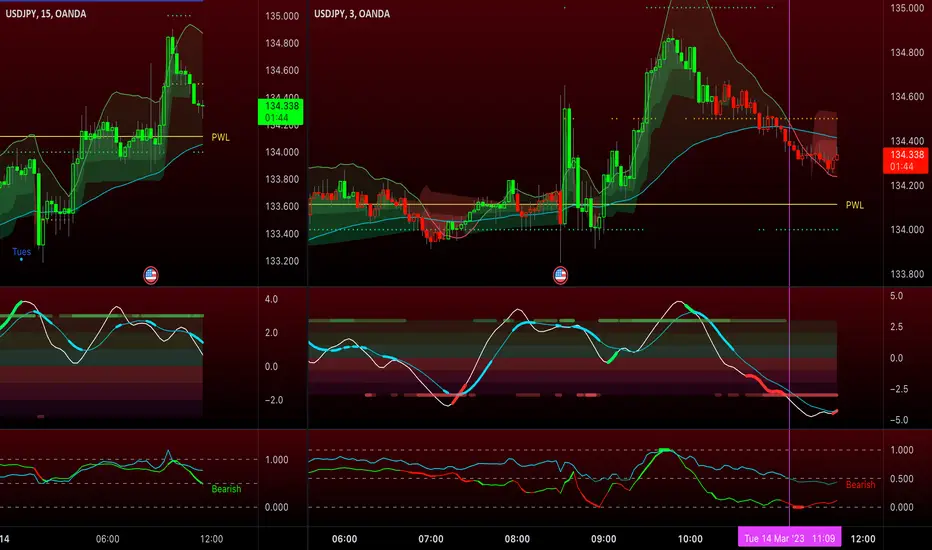
USD/JPY - YES, Another quick Scalp for 10OANDA:USDJPY
A good start to the week.
Quick scalp for 10 hard pips TP, before it hit PWL (previous weeks low).
I tune out the nay sayers that scalping doesn't work, and that I should maximize the trade, which is actually a very smart and profitable strategy when executed properly with trade management.
But I do LOVE scalping and enjoying the rest of my day not being stressed, LOL.
Both techniques work, the key is Trade Management.
Trade well....

USDJPY Long Setup, looking strongGood morning fellow Traders!
I have been tracking the YENUSD pair with great interest in recent weeks as we have been rebounding from its local low. The pair has a beautiful long-term trend on the higher timeframes, setting the direction I have been looking to trade.
We are currently sitting in a sweet spot, the price has been consolidating around 130-137, however, as soon as we have left this range in the past, volatility has kicked in, both ways. We have broken through the high of 137 two days ago, making the idea very plausible and easy to understand.
This is my Game Plan:
- Clean push above 137
- Pullback onto 137 area, preferably seeing a pullback down to 136.8
- Consolidation on the red line, smooth prices needed here
- No big slippage into the box, staying around the red line
- Trigger signal once price starts to recover between 137 to 137.2
- Entry upon jumping out of the box
This trend setup looks very strong because the higher timeframes support the direction we are trading in.
Make sure to follow my Tradingview for more ideas and check out my BNB short post, we are in profits!
Thanks for tuning in and let me know if you liked the video in the comments below.
Many thanks.
TraderCH
