CVX

Energy's volume confirming trendTechnical Short-term Analysis
We have a new potential uptrend line drawn in the chart.
RSI is showing some divergence as it has reached the level from the beginning of February. However; I would take this divergence with a grain of salt, as it did reach Overbought levels and did not break the 40 level on the RSI (typical bullish behavior).
OBV has a clear uptrend, supporting the uptrend in price.
Trade Setup
Would sell a partial position if we break the ~new potential uptrend~.
Would sell the rest if we break the 50sma.
Hope this helps!

Buying Energy dipTechnical Analysis / Trade Setup
There could be a trade coming up next week in energy.
The 50sma has worked as support 2 consecutive times, and could potentially do it again.
This level is also coincidental with the 50% Fibonacci retracement level & 2020 highs; which suggests this support level has more strength.
Backtesting Data
There is a very interesting discrepancy between stocks within the energy sector going on; where most stocks are above the 200sma, byt below their 10sma. --> From 1979 until today, there has only been 12 times where this has happened...
What did it mean going forward?
Energy was up 70% of the time looking a year later, with an average of 27%.
Fundamental Analysis
Bull case for energy:
Oil is priced above the level at which the average company can cover expenses;
Supply has declined with lower production and OPEC compliance;
Large diversified energy companies have strong balance sheets and access to capital;
The ongoing recovery of the global economy bodes well for returning oil demand
Bear case for energy:
Oil demand is still down significantly.
Valuations are opaque.
There is weak long-term stock price momentum.
~ For the full article on sector view, send a message and I will be happy to share the resources I have. ~

CHEVRON - CVX - Small consolidation before continuing higher ?CVX - Looks like it's pulling back to the 103 level for now as part of a potential wave iv.
Strongest resistance is at the 103/105 zone but it would be normal if price drops and bounces off the 99/101 zone too.
The count gets invalidated if it drops below 96 of course.

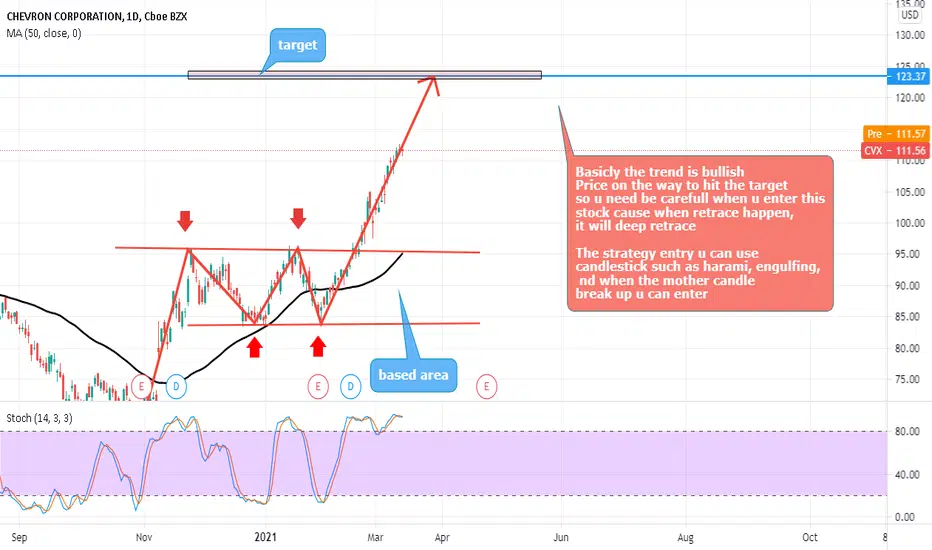
CVX (NYSE) - Go BullishGreetings
Humbled, we would like to thanks for your support who has already liked, commented and followed us. Your support, strengthens us, to help in analyzing the market. If you have any questions, feel free to send us message (inbox).
Pra Trading :
- Please care for Money Management
- Have a good psychology
- Do not be hurry to open position and do not do nothing if u see opportunity
- Evaluate and upgrade your trading plan
Execution Strategy :
- Know what you want to buy, see the Fundamental
- Decide that you are on investing or speculating
- Consider what your strategy based on Investing/Speculating
- Make Road Map Of Your Trading Plan
- Decide
a. Entry strategy
b. Cut loss
c. Target of Profit
Post Trading :
a. Do not be sad if you loss or do not be very happy if you win
b. Just become a normal without emotion, Do not put emotion into your trading
c. Evaluate your trading
d. Keep on Learning
e. Be Humble
Idea :
CVX (NYSE) - Go Bullish
BP Cup and handle in cup and handle. LongBP has formed 2 cup and handles, a smaller one inside the larger one. Price target remains retracement upward, around 31. following 31 we can see 37 by EOY. On the fundamental side take a look at the 20 year crude futures chart. W We just broke out of immense resistance line at 60 dollars a barrel. Crude can expect to see $75 shortly which only helps oil stocks like xom cvx and bp.

SPY/DIALooks to be a divergence forming in the SPY/DIA chart between purchasing volume and valuation. Stoch is also approaching overbought but RSI is still within a good limit. Could indicate a coming pause in the cycling of the market after the recent upswing in value/non-tech companies. Could be a good time to get into some value companies or to check your charts for the same divergence and hedge or short if it makes sense.
Similar divergence found on the daily SYF, CVX, and KHC daily charts. All three are also reaching overbought levels in either the Stoch 14/3/3, RSI or both.

Chevron will do what he want but...After a beautiful double bottom done, CVX is now probably in the consolidation area where we need looking for further setups if price will follow ascending triangle...
Inverse head & sholder is here just for fun :) ( but it would be fun if it happened)
Stay tuned.
NYSE:CVX

Most important resistance level!I think CVX will test its most important resistance level at 115 next week. We should wait and see if it could pass.

Chevron due for breakoutChevron might finally break out of resistance around 95.6$. This was THE resistance for 2020.
Fundamentals brightened up and HSBC raised it to buy from hold with a target of $105.

Natural Gas --- ( 2 0 2 1 ) Swing TradeAlas! I am free to post what I want thanks to the help of everyone's contribution thumbs.
------------------------------------------
The Natural Gas setup for 2021 is not only fundamentally bullish, it's a technical trader's gassy dream.
Welcome to the G a s i n o.
Macro View
From a macro view we can see that prices are now at the bottom of a historically supportive range. The previous deviations that dipped below this range were due to the bearish sentiment as production was trending up. This is no longer the case. Sentiment has now flipped cautiously bullish as supply/demand balance is expected to remain tight.
Bullish Indicators
First, we can see the weekly MACD is decisively bullish and above the zero line. This confirms momentum is going to likely remain bullish longer term.
Secondly, looking at the Commitment of Traders (COT) report on the indicator below the MACD, we see that Asset Managers and Speculators are more interested in long positions than usual. Should be plenty more next year.
Thirdly, prices are maintaining above the 50 week EMA.
Not to mention the inverse head and shoulders that is under construction. You heard it here first.
The Trade Setup
Now, if we overlay two important contracts for Summer(orange) and Winter(blue), we can start extrapolating potential targets. Current prices for either one are at the bottom of the range. This is what large speculators are looking at. This is where I am going to start accumulating starting with Summer. In addition, I am also buying dips of EQT as producers will benefit from stronger prices over the next couple years.
Looking at the August 2021 contract, prices have broken out of the down trend.
Today, in anticipation of a large swing trade next year, I opened a starting long position on the mini contract (QGQ2021) @ $2.78
I welcome dips and estimate a sell target somewhere well north of $3.00
TBD
Trading is risky, don't do it.
Long EQT and
QGQ2021 +1 @ 2.78

A Measured Move could take CVX to the Century Mark 100the Extreme Turn Buy signal comes in at a key support zone. CVX showed an impulse move from %83 to $95.50. The initial Ext Turn buy produced a nice winner and now we're back at the key
level as the markets trade to new highs. Could pull in to till the $85-86 Gap then go. Looking for 4% move to High to High trendline then 13% to $100 on a 1 to 1 move from the impulse leg.
Options Trade: CVX option would be JAN 85/100 Bull Call Spread for $5 or better.

Short Energy sector 🛢️ - Swingtrade, high Risk/Reward trade If you like the idea, do not forget to support with a 👍 like and follow or comment.
Leave a comment that is helpful or encouraging. Let's master the markets together.
Hi fellows, just one of my today swingrades:
As you can see ERY bottomed out and forming a bull flag pattern.Rising bull momentum is there clearly represent by divergence on Momentum and CCI indicators. Today will be good opportunity to get in.
------------------------Trade setup ---------------------------
Entry: 34.34
Stop Loss: 32.75
Profit target: 39.76
Time stop: 5 days
------------------------------------------------------------------

CVX-2.169*XOM $XOM Exxon Mobil Corp vs. $CVX Chevron CorpQuantamental Tools for Proprietary and Retail Investors.
Statistical Arbitrage Opportunities Delivered to Your Inbox.
QuantChart. io
Long 1000 $CVX
Short 2169 $XOM
Mean Reversion Time: 12 Trading Days

CVX-2.169*XOM $CVX Chevron Corp vs. $XOM Exxon Mobil CorpQuantamental Tools for Proprietary and Retail Investors.
Statistical Arbitrage Opportunities Delivered to Your Inbox.
QuantChart. io
Long 1000 $CVX
Short 2169 $XOM
Mean Reversion Time: 12 Trading Days

Crude oil recent ascends meeting roadblock aheadThe recent breakout made by the crude oil may excite buying opportunities to some. For how long it will last will need to be seen if it could penetrate several layers of resistance ahead. This week price action was not powerful enough to sustain the move. Catalyst and sentiment that could influence the price action not supporting the move too, as energy giants such Exxon Mobile (XOM), Chevron (CVX), BP and Royal Dutch Shell (RDSA) giving cautious forecasts on the price projectile. Nearly all of the energy giants viewed the price of crude oil will only top $60.00 a barrel by 2026/27.
Next week, OPEC+ will meet from Monday to Tuesday to decide on the current crude oil production output, which at the current pace produced a limited volume to stabilize the price.


Oil Bears in for a Crude AwakeningDon't get excited just yet. The only certainty in the oil game is it's not for the faint of heart and right now, the bears are getting crushed.
Now that prices are gearing up it looks like it's time to make a new plan. Before I do let's recap the last one.
Previously I had noticed a particular trendline that prices broke out of in early August. As that breakout failed, it seemed a retest of that trendline was inevitable.
Prices bounced right back up to a macro fib retracement level (@ $40) as they often do, like a magnet.
Then after it failed at that fib level and retested that trendline again, I noticed a potential tricky oil move playing out: the head and shoulders fake out.
Now here we are breaking $40.50 and the 50 Week EMA. Although I have been buying oil stocks on these dips I am not trading futures just yet until prices can stabilize above $40. Eventually, I'd like to see a weekly close above that 50 week EMA and then start buying dips on the 1 hour chart all the way up to the 200 week EMA at $51.50
The MACD on the monthly chart is showing a nice divergence and as always, I'm keeping an eye on that macro Fib retracement level at $40 as the pivot point.
Trading is risky. Don't listen to my advice.
Long LUKOY, KMI and buying dips

𝗖𝗿𝘂𝗱𝗲 𝗨𝗽𝗱𝗮𝘁𝗲: $CL_F Daily. Triangle BreakdownConsolidated into triangle in August/September, which has broken down. Failed to get a golden cross. Possible run towards 26-28 area which is major area
$USO $XLE $XOM $CVX $XOP $GUSH $DRIP $SPY #Oil #CrudeOil #OOTT 🛢️

LONG CVXExpecting bounce from extremely oversold weekly and daily levels. If stop breached, be prepared to catch new daily reversal on lower levels with a tight stop.

CHEVRON CORP. LONG📈 NYSE:CVX LONG H4
🛒BUY above = 74.46
🎯Target1 = 77.95
🎯Target2 = 80.10
🎯Target3 = 83.60
🛑Stop loss or cancel trade = 68.80
🙈Recommended risk = (1%-2%)

CVX breaks 13 Day EMA and heads for the 21 Day EMAMuch like most stocks, Chevron NYSE:CVX didn't have a good month of September this year, but it looks like things might be turning around. Looking at the daily chart above, CVX, as been trying to break past the 8 EMA average throughout the last month but found little success until yesterday. Today the price broke through the 13 day EMA. As the stock heads towards the 21 day EMA, one of two things can happen. It can pull up to it and continue down or it breaks past the 21 day EMA and continues going up. Rather than trade directionally, option traders should consider selling put credit spreads. Although this way cap the upside, it also limits your downside .

CVX - Chevron buy support zones analysisHello traders,
Description of the analysis:
Chevron corp. ( CVX ) support zones ideal for timing long positions (gray). Trade what you understand, trade carefully and sparingly according to the business plan.
About me:
Hi, my name is Jacob Kovarik and I´m trading on stock exchange since 2008. I started with a capital of 3000 USD. My first strategy was based on OTM options. (American stock index and their ETF ). I´ve learnt on my path that professional trading is based on two main fundaments which have to complement each other, to make a bussiness attitude profitable. I´ve tried a lot of techniques and many manners how to analyze the market. From basic technical analysis to fundamental analysis of single title. My analytics gradually changed into professional attitude. I work with logical advantages of stock exchange (return of value back to average, volume , expected volatility , advantage of high stop-loss, the breakdown of time in options, statistics and cosistent thorough control of risk). At the moment, my main target is ITM on SPM index. Biggest part of my current bussiness activity comes from e mini futures (NQ, ES). I´m trader of positions. I´m from Czech republic and I take care of a private fund (over $4.000.000 USD). During my career I´ve earned a lot of valuable experience, such as functionality of strategies and what is more important, control of emotions. Professional trading is, in my opinion, certain kind of mental training and if we are able to control our emotions, accomplishment will show up. I will share with you my analysis and trades on my profile. I wish to all of you successul trades.
Jacob
