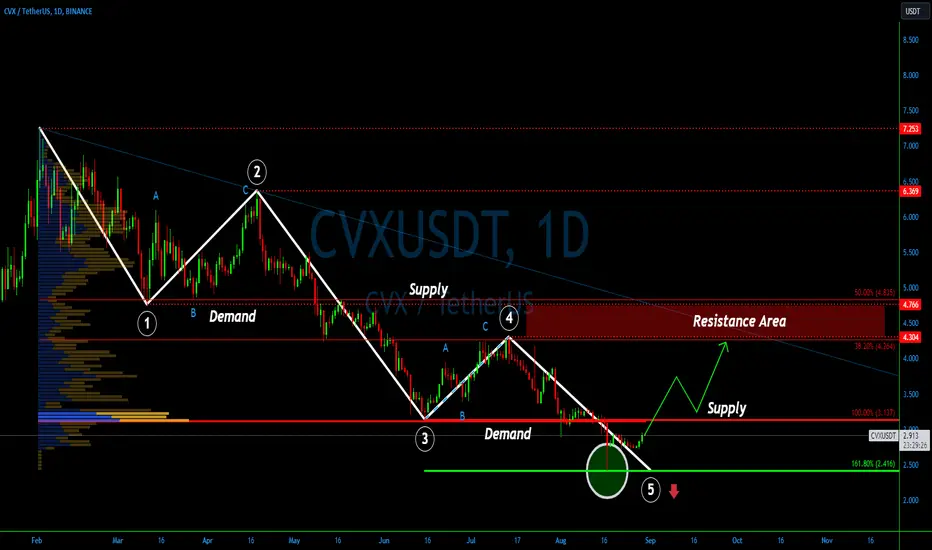
CVXUSDT Story through the Elliot Wave Lens💎The #CVXUSDT chart is currently painting a fascinating narrative, reminiscent of the classic Elliot Wave theory. Since the dawn of this year, the asset has witnessed a consistent dip. Between February and August, #CVX plummeted by a staggering 66.6%, leaving investors pondering about its future prospects.
💎However, there's a silver lining for the optimists. A few weeks ago, #CVX might have wrapped up its 5th downward wave, signaling the end of the Elliot Wave cycle. This speculation stems from the impeccable bounce off the 161.8% Fibonacci support, precisely at $2.416. Such a move often heralds a potential shift in the long-term trend, and our team is gearing up to respond.
💎Our next milestone? We're keenly observing the $3.13 supply zone, which previously played the role of a demand area. A confident breach above this threshold could see it morph back into a support zone, paving the way for a bullish trajectory. If this transformation occurs, #CVX might embark on an upward journey, possibly targeting the resistance bracket of $4.26 - $4.83. This could translate to a potential 50% price surge in the forthcoming weeks. But remember, this is just the initial resistance; there's room for the price to soar by 100% or even more.
For those eager to stay abreast of the evolving #CVX landscape, keep your eyes peeled for our updates.
CVX
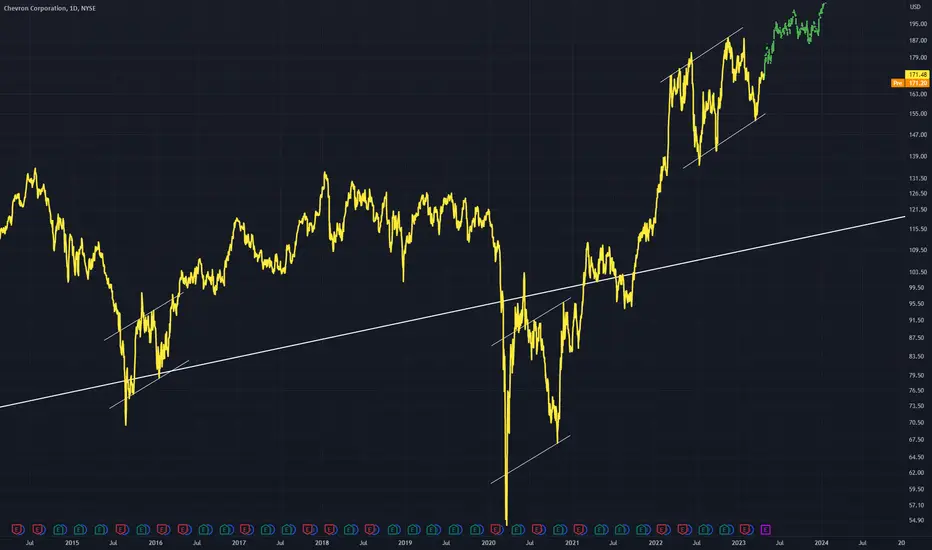
Chevron in a range.Chevron Corporation - 30d expiry - We look to Buy at 157.22 (stop at 154.02)
We look to trade the current range.
156.22 has been pivotal.
Support is located at 157 and should stem dips to this area.
We look to buy dips.
The primary trend remains bullish.
Our profit targets will be 165.22 and 167.22
Resistance: 162.00 / 164.25 / 166.00
Support: 159.00 / 156.22 / 154.00
Please be advised that the information presented on TradingView is provided to Vantage (‘Vantage Global Limited’, ‘we’) by a third-party provider (‘Everest Fortune Group’). Please be reminded that you are solely responsible for the trading decisions on your account. There is a very high degree of risk involved in trading. Any information and/or content is intended entirely for research, educational and informational purposes only and does not constitute investment or consultation advice or investment strategy. The information is not tailored to the investment needs of any specific person and therefore does not involve a consideration of any of the investment objectives, financial situation or needs of any viewer that may receive it. Kindly also note that past performance is not a reliable indicator of future results. Actual results may differ materially from those anticipated in forward-looking or past performance statements. We assume no liability as to the accuracy or completeness of any of the information and/or content provided herein and the Company cannot be held responsible for any omission, mistake nor for any loss or damage including without limitation to any loss of profit which may arise from reliance on any information supplied by Everest Fortune Group

XLE - Falling Trend Channel🔹Breakout Falling Trend Ceiling in medium long term.
🔹Once breakout resistance 87.4 be POSITIVE signal.
🔹Short-term momentum is POSITIVE with RSI above 70.
Chart Pattern;
🔹DT - Double Top | BEARISH | 🔴
🔹DB - Double Bottom | BULLISH | 🟢
🔹HNS - Head & Shoulder | BEARISH | 🔴
🔹REC - Rectangle | 🔵
🔹iHNS - inverse head & Shoulder | BULLISH | 🟢
Verify it first and believe later.
WavePoint ❤️

CVX to find buyers at current support?Chevron Corporation - 30d expiry - We look to Buy at 150.33 (stop at 146.33)
150 continues to hold back the bears.
We look to buy dips.
149.91 has been pivotal.
149.74 has been pivotal.
This is currently an actively traded stock.
Our profit targets will be 160.33 and 162.33
Resistance: 155.00 / 157.00 / 160.77
Support: 152.00 / 149.74 / 148.00
Please be advised that the information presented on TradingView is provided to Vantage (‘Vantage Global Limited’, ‘we’) by a third-party provider (‘Everest Fortune Group’). Please be reminded that you are solely responsible for the trading decisions on your account. There is a very high degree of risk involved in trading. Any information and/or content is intended entirely for research, educational and informational purposes only and does not constitute investment or consultation advice or investment strategy. The information is not tailored to the investment needs of any specific person and therefore does not involve a consideration of any of the investment objectives, financial situation or needs of any viewer that may receive it. Kindly also note that past performance is not a reliable indicator of future results. Actual results may differ materially from those anticipated in forward-looking or past performance statements. We assume no liability as to the accuracy or completeness of any of the information and/or content provided herein and the Company cannot be held responsible for any omission, mistake nor for any loss or damage including without limitation to any loss of profit which may arise from reliance on any information supplied by Everest Fortune Group.

CVXUSDT"Daily crypto market analyses I provide are personal opinions & not financial advice. Trading carries risks, so do your own research & seek advisor's help."

CVX ChevronChevron broken H&S neckline, retesting and holding as resistance, look left PT 104 last area of consolidation, also vol profile shelf. Risk to Reward favors a trade risking a daily close above neckline recovery

CVX - Bullflag PotentialA flag like formation.
This could either break out really nicely.
However if it doesn't break out it is out of the fault of a double top.

CVX 100% :)Expecting CVX TO Go 100% up From here Good reward and small risk To go Mybe one of the best but lets see in past had did many 100% coin trades lets hope its also one more

cvx short setupHello Traders, here is the full analysis for this pair, let me know in the comment section below if you have any questions, the entry will be taken only if all rules of the strategies will be satisfied. I suggest you keep this pair on your watchlist and see if the rules of your strategy are satisfied. Please also refer to the Important Risk Notice linked below.

CVXUSD Hourly Double TopDouble Top within a down channel
This will likely lead to extended downfalls if the channel does not provide support
Double tops are a bearish pattern

CVX - Continuation Pattern Above Trend LineAn idea for CVX showing similar double bottom formations in a strange sort of inverted H&S way.
If you do consider this a H&S we just experienced the right shoulder, following this is a bullish period, hence my continuation assumption in green bars pattern.
Thicker Trendline is a longer term trend line

CVX = Long Set-Up I'm bullish on WTI and the energy sector in general at this level.
I like Chevron which is close to my buy point for a fifth wave to new highs.
Chart pretty much says it all. Wait for it. It needs to find at bottom at the confluence of trendlines on the chart.
I'll update as needed in the near future

CVXUSDT | +5 Risk / Reward Ratio#CVX/USDT
CVX tested 4.77 level many times till now and it's considered a very important level
and this level now is our major support and we may use it as our stop-loss for this trade.
🟢Entry price: from now at 5.3 to 4.9
🎯Targets:
|> 6
|> 7
|> 8
🔴Stop-loss: Daily candle closes under 4.77
➡️Recommended risk: 0.25%
➡️Recommended total Positions Size: 3.5%

Cvxusdt Breakout And retestCvxusdt
CVX/USDT, ,has shown a symmetrical triangle pattern breakout and retest, which has been confirmed on the 4-hour time-frame. A symmetrical triangle is a chart pattern that typically forms when a security's price is consolidating, creating a series of higher lows and lower highs. This pattern indicates that the market is indecisive about the future direction of the asset.
The confirmation of the pattern breakout and retest on the 4-hour time-frame suggests that CVX/USDT is likely to experience a significant price move in the near future. In this case, the breakout is bullish, indicating that prices are expected to move higher. As a result, traders may look to take a long position in the asset.
Based on the breakout and retest pattern, we anticipate a 30-50% bullish move in the upcoming days. This implies that the price of CVX/USDT is expected to rise by 30-50% from its current level. However, it is important to note that trading always involves risk, and there is no guarantee that the price will move in the anticipated direction.
In summary, based on the confirmed symmetrical triangle pattern breakout and retest on the 4-hour time-frame, traders may consider taking a long position in CVX/USDT, with an expectation of a 30-50% bullish move in the coming days. However, traders should always conduct their own analysis and risk management before entering any trade.

cvx Getting ready For Another bullish impulse Seems Like Getting ready to continue Its Uptrend
Formed Bullish Pennant Incase Of breakout expecting 60 to 65% bullish move Keep eyes On Cvx For breakout

CVXUSDT go and buy at 6,804AROON UP is at 100/0, RSI is at 54/48, I don't think it will reach the highest point soon, but I go and buy at 6,804

Convex Finance (CVX) forming bullish Cypher for upto 21.50% moveHi dear friends, hope you are well and welcome to the new update on Convex Finance ( CVX ) with US Dollar pair.
Previously we caught a nice trade of CVX as below:
Now on a 4-hr time frame, CVX is about to complete the final leg of a bullish Cypher move for another price reversal.
Note: Above idea is for educational purpose only. It is advised to diversify and strictly follow the stop loss, and don't get stuck with trade

XOM, Possible Long Term Play with around 200 targetExxon Mobil Corporation stock MAY see around 200 USD price in up coming years !
Today, we are going to investigate one of the giant oil companies. XOM has completed a complete ascending wave cycle from 1970 to 2020 . Impulsive section of this wave cycle was between 1970 and 2014 and corrective section started at 104.76 (former ATH) on 2014 and lasted for 6 years . On Mar 2020 stock bottomed with double bottom pattern at 30.11 USD around 0.786 Retracement level of the whole large time frame bull run. This complete wave cycle can be labeled as primary degree wave 1 and 2 of the larger degree wave cycle ( cycle degree).
After end of primary degree wave 2 , a considerable up side move started which strongly broke multi years down trend line and reclaimed the ATH ( actually made a new one ). This strong and steep up going wave can be considered as primary degree wave 3 which can push the stock up to around 200 USD. This primary degree wave 3 can itself be divided to 5 intermediate wave degree and I suppose currently we are in wave 4 (minor degree ) of wave 1 (intermediate degree) of 3 ( Primary degree ).
What all above explanation means? It means most probably we have an up side move from around 78 to around 116 USD . Then , a considerable correction of intermediate degree wave 2 of primary degree wave 3 may start which can hammer down stock to around 63 USD . After that , most powerful and steep wave will start which can break the upper bond dynamic resistance ( as this the typical character of wave 3 of 3) and lead the stock to above 150 USD. All other predicted wave moves are shown on the chart.
Therefore, I certainly keep XOM in my watch list to open a profitable long position in appropriate time ( most probably in up coming weeks).
Please note our chart is in monthly time frame and there may be many fluctuations in up coming weeks and days. In addition, timing on the chart may become incorrect as timing is the most difficult task in charting. Also I kindly ask you to keep in mind this is before the fact long term prediction and normally it may need some updates in future.
I hope this analysis to be useful and wish you all the best.

$XLE - Weakness in the Energy Sector Could Bring Stage 4 DeclineThe Energy sector is notoriously one of the last to roll over in a recessionary environment and the $XLE chart appears to be topping out right on queue.
After a euphoric run beginning in the middle of 2020, the Energy sector has stalled out creating a triple top near the $90 level.
With the break of the 200-day moving average, along with an accompanying bearish momentum regime in the RSI, we expect the Energy sector to begin its descent into a Stage 4 decline.
Many individual stocks within the Energy sector look prime for capitulation events and accompanying sector weakness would further aggravate already anemic charts.
PT near 60.

CVX IS BEARISHHi, dear traders. how are you ? Today we have a viewpoint to SELL/SHORT the CVX symbol.
For risk management, please don't forget stop loss and capital management
When we reach the first target, save some profit and then change the stop to entry
Comment if you have any questions
Thank You

XOM breaking downWith the recent weakness in Oil and natural gas, its likely impacting the performance of XOM stocks going forward. XOM is testing some key areas. If the levels break the target on XOM is $100.00

CVX (Y23.P1.E1).Contracting triangleHi Traders,
This formation is so far aligned with a continuation pattern.
The 3rd target is the macro resistance trendline.
With contracting triangles, we have a number of models.
As per the chart, I have outlined the most common.
However this also aligns so far with the wyckoff distribution as well.
Please give me a like and share,
Regards,
S.SAri
Note the RSI for the bullish signal
