CVX/USDT Weekly Analysis — Strong Reversal Zone CouldTechnical Analysis:
1. Strong Demand Zone (Key Reversal Area)
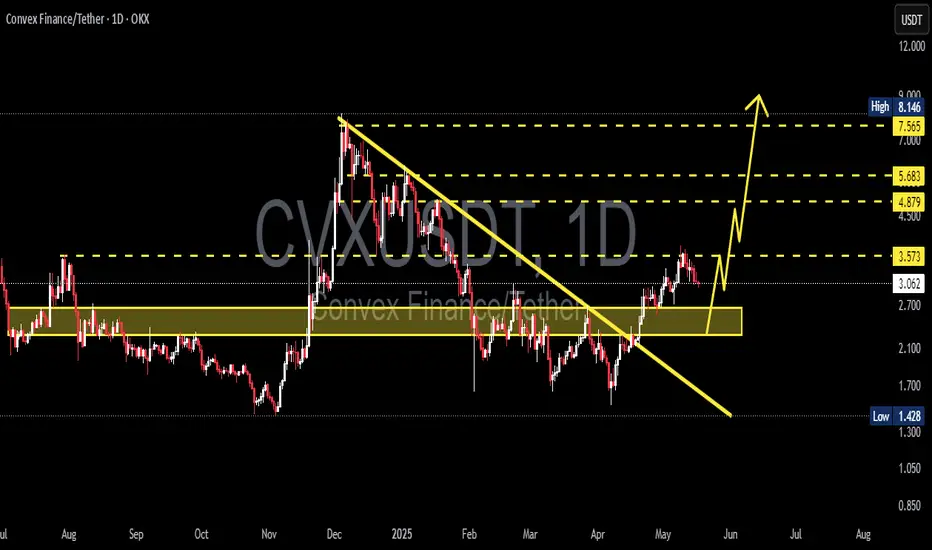
CVX price has repeatedly tested a strong support zone around $1.43 – $2.20 (highlighted in yellow). This area has acted as a major accumulation zone, showing strong buyer interest and serving as a critical base support.
2. Potential Double Bottom Formation (Bullish Reversal Pattern)
A potential Double Bottom or Adam & Eve pattern is forming within this demand zone — a classic bullish reversal structure, indicating a possible trend shift to the upside.
3. Key Resistance Levels (Bullish Targets):
$2.90 – Minor resistance, likely to be tested in the short term.
$3.46 – Significant psychological and technical resistance.
$4.98 – Major resistance and neckline of the double bottom pattern.
$6.76 – Strong weekly resistance, a potential medium-term target.
$15.77 & $47.97 – Long-term targets if a macro bullish trend emerges.
Bullish Scenario:
If the price holds above the $2.20 support zone:
Gradual upward movement expected toward $2.90 → $3.46 → $4.98.
A confirmed breakout above $4.98 could trigger a rally toward $6.76.
Full bullish confirmation would occur if the price breaks and holds above $6.76, indicating a longer-term trend reversal.
Bearish Scenario:
If price breaks down below the $1.43 support level with a weekly close:
The double bottom structure would be invalidated.
Price could enter new price discovery territory, potentially heading below $1.00.
Market sentiment would turn significantly bearish.
Strategic Conclusion:
CVX/USDT is currently at a critical decision point. A strong historical support zone suggests a high potential for bullish reversal. Confirmation of the bullish structure requires a breakout above $4.98. However, caution is needed if price breaks below $1.43, as it may indicate structural failure.
#CVXUSDT #ConvexFinance #CryptoAnalysis #DoubleBottom #ReversalPattern #BullishSetup #AltcoinAnalysis #SupportResistance #CryptoBreakout #TechnicalAnalysis
CVXUSD

#CVX best zone for make some money SOON ?#CVX
The price is moving within a descending channel on the 1-hour frame, adhering well to it, and is heading for a strong breakout and retest.
We are experiencing a bounce from the lower boundary of the descending channel. This support is at 2.30.
We have a downtrend on the RSI indicator that is about to be broken and retested, supporting the upside.
There is a major support area in green at 2.23, which represents a strong basis for the upside.
Don't forget a simple thing: ease and capital.
When you reach the first target, save some money and then change your stop-loss order to an entry order.
For inquiries, please leave a comment.
We are in a consolidation trend above the 100 Moving Average.
Entry price: 2.41
First target: 2.46
Second target: 2.55
Third target: 2.65
Don't forget a simple thing: ease and capital.
When you reach your first target, save some money and then change your stop-loss order to an entry order.
For inquiries, please leave a comment.
Thank you.

#CVX/USDT#CVX
The price is moving within a descending channel on the 1-hour frame, adhering well to it, and is heading towards a strong breakout and retest.
We are experiencing a rebound from the lower boundary of the descending channel, which is support at 2.644.
We are experiencing a downtrend on the RSI indicator that is about to be broken and retested, supporting the upward trend.
We are heading towards stability above the 100 Moving Average.
Entry price: 2.730
First target: 2.800
Second target: 2.860
Third target: 2.924

#CVX/USDT#CVX
The price is moving within a descending channel on the 1-hour frame, adhering well to it, and is heading for a strong breakout and retest.
We are seeing a bounce from the lower boundary of the descending channel, which is support at 2.97.
We have a downtrend on the RSI indicator that is about to break and retest, supporting the upward trend.
We are looking for stability above the 100 Moving Average.
Entry price: 3.30
First target: 3.43
Second target: 3.59
Third target: 3.77

CVXUSDT 1D AnalysisCVX ~ 1D Analysis
#CVX Buy back on retest of this support block with short term target of at least 10%+ from here.
#CVX/USDT#CVX
The price is moving within a descending channel on the 1-hour frame and is expected to break and continue upward.
We have a trend to stabilize above the 100 moving average once again.
We have a downtrend on the RSI indicator, which supports the upward move by breaking it upward.
We have a support area at the lower limit of the channel at 3.00, which acts as strong support from which the price can rebound.
Entry price: 3.14
First target: 3.26
Second target: 3.42
Third target: 3.58

#CVX/USDT#CVX
The price is moving within a descending channel on the 1-hour frame, adhering well to it, and is heading for a strong breakout and retest.
We are seeing a bounce from the lower boundary of the descending channel, which is support at 2.98.
We have a downtrend on the RSI indicator that is about to break and retest, supporting the upward trend.
We are looking for stability above the 100 Moving Average.
Entry price: 3.05
First target: 3.14
Second target: 3.24
Third target: 3.36

#CVX/USDT#CVX
The price is moving within a descending channel on the 1-hour frame and is expected to break and continue upward.
We have a trend to stabilize above the 100 moving average once again.
We have a downtrend on the RSI indicator that supports the upward move with a breakout.
We have a support area at the lower limit of the channel at 2.72, which acts as strong support from which the price can rebound.
Entry price: 2.83
First target: 2.90
Second target: 2.97
Third target: 3.06

CVXUSDT 1WCVX ~ 1W Analysis
#CVX Buy gradually from here if you still have a Conviction on this coin with a short -term target of at least 20%+.

If it receives support at 2.179-2.862, it is time to buy
Hello, traders.
If you "Follow", you can always get new information quickly.
Please also click "Boost".
Have a nice day today.
-------------------------------------
(CVXUSDT 1D chart)
The key is whether it can receive support near 2.835-2.862 and rise above 3.267.
Since the StochRSI indicator is showing signs of entering the overbought zone again, if it does not receive support near 2.835-2.862,
1st: 2.472
2nd: 2.179
It is expected to fall to the 1st and 2nd levels above.
Since the HA-Low indicator of each chart is located in the 2.179-2.862 range, if it is supported within this range, it is a time to buy.
The fact that the HA-Low indicator was created means that it has moved out of the low range.
-
Since the HA-High indicator of the 1W chart is formed at the 3.267 point, if it is supported at this point, I think that a full-scale uptrend is likely to begin.
However, since the M-Signal indicator of the 1M chart is passing around 4.086, the point to watch is whether it can rise above this point and maintain the price.
-
If it falls below 2.179, you should check whether it is supported when the HA-Low indicator is created again and determine whether trading is possible.
-
Thank you for reading to the end.
I hope you have a successful transaction.
--------------------------------------------------
- Big picture
I used TradingView's INDEX chart to check the entire range of BTC.
(BTCUSD 12M chart)
Looking at the big picture, it seems to have been following a pattern since 2015.
In other words, it is a pattern that maintains a 3-year bull market and faces a 1-year bear market.
Accordingly, the bull market is expected to continue until 2025.
-
(LOG chart)
Looking at the LOG chart, we can see that the increase is decreasing.
Accordingly, the 46K-48K range is expected to be a very important support and resistance range from a long-term perspective.
Therefore, we do not expect to see prices below 44K-48K in the future.
-
The Fibonacci ratio on the left is the Fibonacci ratio of the uptrend that started in 2015.
That is, the Fibonacci ratio of the first wave of the uptrend.
The Fibonacci ratio on the right is the Fibonacci ratio of the uptrend that started in 2019.
Therefore, this Fibonacci ratio is expected to be used until 2026.
-
No matter what anyone says, the chart has already been created and is already moving.
It is up to you how to view and respond to it.
Since there is no support or resistance point when the ATH is updated, the Fibonacci ratio can be appropriately utilized.
However, although the Fibonacci ratio is useful for chart analysis, it is ambiguous to use it as a support and resistance role.
The reason is that the user must directly select the important selection points required to create the Fibonacci.
Therefore, it can be useful for chart analysis because it is expressed differently depending on how the user specifies the selection point, but it can be seen as ambiguous for use in trading strategies.
1st: 44234.54
2nd: 61383.23
3rd: 89126.41
101875.70-106275.10 (when overshooting)
4th: 134018.28
151166.97-157451.83 (when overshooting)
5th: 178910.15
-----------------

#CVX/USDT Ready to launch upwards#CVX
The price is moving in a descending channel on the 1-hour frame and is adhering to it well and is heading to break it strongly upwards
We have a bounce from the lower limit of the descending channel, this support is at a price of 2.85
We have a downtrend on the RSI indicator that is about to be broken, which supports the rise
We have a trend to stabilize above the moving average 100
Entry price 3.15
First target 3.26
Second target 3.41
Third target 3.61

CVX Technical Analysis in a Weekly TimeframeHello everyone, I’m Cryptorphic.
I’ve been sharing insightful charts and analysis for the past seven years.
Follow me for:
~ Unbiased analyses on trending altcoins.
~ Identifying altcoins with 10x-50x potential.
~ Futures trade setups.
~ Daily updates on Bitcoin and Ethereum.
~ High time frame (HTF) market bottom and top calls.
~ Short-term market movements.
~ Charts supported by critical fundamentals.
Now, let’s dive into this chart analysis:
CVX recently hit its all-time low at $1.80, where the support trendline is holding the price. The chart shows an expanding triangle pattern, while the RSI is forming a bullish divergence, suggesting that the price may accelerate toward the resistance trendline.
Key levels:
- Support/Accumulation: $1.6 to CMP.
- Resistance/Target: $4.
- Higher Target: $7.5.
DYOR, NFA.
Please hit the like button to support my content and share your thoughts in the comment section. Feel free to request any chart analysis you’d like to see!
Thank you!
#PEACE

#CVX/USDT#CVX
The price is moving within a descending channel pattern on the 12-hour frame, which is a retracement pattern
We have a bounce from a green support area at 2.12
We have a tendency to stabilize above the Moving Average 100
We have a downtrend on the RSI indicator that supports the rise and gives greater momentum and the price is based on it
Entry price 2.26
First target 2.46
Second goal 2.73
Third goal 3.03

Convex Finance CVX price surprises with growthWhile #CRV fell in price instantly -30-40% and liquidated everyone on its way.
The #Convex Finance #CVX DeFi protocol, which allows LSE:CRV liquidity providers to receive a share of trading commissions on the #Curve without staking liquidity there, made +150% "on easy"
This only shows how the market works and how capital flows: someone's loss in the market is someone's gain at the moment who chose the right direction (or created it :)
All we have to do is wait for the spot when our/your alts make a similar curtsy)

#CVX/USDT#CVX
The price is moving in a bearish channel on the 12-hour frame and is largely sticking to it
We have a green support area at 2.20 that is expected to be bounced from due to its strength
We have a trend to hold above the Moving Average 100, which is strong support for the rise
We have very strong oversold conditions on the RSI indicator to support the rise with a strong uptrend
Entry price 2.38
The first goal is 2.62
Second goal 2.82
Third goal 3.09

#CVX/USDT#CVX
The price is moving in a downward channel on a 4-hour frame, about to break upward
We have an uptrend on the RSI indicator about to occur. Bounce up
We have a higher stability moving average of 100
Entry price is 4.16
The first goal is 4.30
The second goal is 4.60
The third goal is 4.95

#CVX/USDT#CVX
The price has been moving in a perfect head and shoulders pattern since last May
We are now in the stage of forming the right shoulder of the model
Current price 3.58
First goal 4.125
Second goal 4.61
Third goal 5.063
Which represents 185% of the current price

🚀 CVX Rocket: A Journey into the Stars! 📈🚀🚀 CVX Rocket: A Journey into the Stars! 📈🚀
Hello Fellow Traders! 👋
CVX is on our radar, and it's poised for an exhilarating journey. Here's the scoop:
🎯 Targets in Red and White:
Zoom in on those red lines – they're your targets! But wait, there's more! The white trend lines unveil additional targets, offering a comprehensive roadmap.
🔄 Supply Check:
With a circulating supply of only 92,646,235 CVX, this crypto is in accumulation mode – a potential spark for exciting price movements.
💚 Prime Buy Opportunity:
Spot that green line? That's your golden buy opportunity! Keep some cash handy in case the market decides to dance to a different tune.
Top Trading Tips:
DCA (Dollar-Cost Averaging): The seasoned trader's secret weapon.
Diversify: Don't gamble your entire stash on one play.
🚨 Disclaimer:
This isn't financial advice. Success in crypto demands diligent research and strategic moves.
Wishing you the best of luck on this crypto adventure! 🌌💰

#CVX/USDT#CVX
The price is moving in a descending channel on a 4-hour frame
Supported by the breakout of the Moving Average 100 and bullish momentum
It is expected that this descending channel will be broken upward
Current price 3.36
First goal 3.42
Second goal 3.56
Third HDQ 3.73
Fourth HDQ 3.88

CVX is a big bullCVX is very bullish in our view.
A large diametric is finished. CVX is expected to pump more soon.
Note that the wave that CVX is in now is very valuable.
We have a flip zone on the chart, as long as this zone is maintained, the targets specified on the chart are available.
Closing a daily candle below the flip zone will violate the analysis
For risk management, please don't forget stop loss and capital management
When we reach the first target, save some profit and then change the stop to entry
Comment if you have any questions
Thank You

#CVX/USDT#CVX
On a 4-hour frame, a perfect head and shoulders pattern
We are about to break the right shoulder higher
We have strong upward momentum that the price is expected to continue rising
Entry price 3.024
First goal 3.08
Second goal 3.188
Third goal 3.287

#CVX/USDT Long#CVX
The price is moving in a descending triangle on the 4-hour frame
We have oversold conditions on the MACD indicator
We have a downtrend, and by breaking it, we have a good rise
Current price 2.74
The first goal is 2.86
Second goal 3.04

Convex Finance #CVX inverse head and shoulders $7.25 tgtInteracting with the neckline
breakout could happen at any time
Good Luck.
