The Canadian Dollar Index CXY on 1WEEK timeframe with cycles. Just a coincidence, I'm sure... But Canada's current Prime Minister just resigned exactly at the end of the 3rd cycle on a 9 year major support level. Is the Canadian dollar about to reverse? Pay attention to Canadian news over the next 6 months to support this idea.
CXY

USDCAD Bullish Continuation (Is the gap getting filled?)USDCAD price seems to exhibit signs of overall bullish momentum as the price action may form a credible Higher Low on key Fibonacci and Support levels.
Trade Plan :
Entry @ 1.44700
Stop Loss @ 1.42000
TP 1 @ 1.47632
TP 2 @ 1.50494
Move Stop Loss to Break Even if TP1 hits.

USD/CAD Will it pullback!?Hello Ladies and Gentlemen!
I might have entered a tad early in this position, though it looks like it is forming a pullback.
The position is currently in a loss and that is okay. Let´s see if it works out.

USDJPY|FIRST LONG THAN SHORT!We see the USDJPY in the one-hour time frame.
In the upward trend that was previously in the form of an upward channel, this channel has broken down and broken its support level.
In the continuation of its downward trend to enter sales positions.
Important areas of supply and demand are drawn on the chart.
In the returns to the supply areas that I have drawn, enter sell positions with confirmation.
My target for long positions is the supply area of 147.50.
For short positions, the demand area is 146.70.

USDCHF 19/11/23Usd chf following the bearish order flow as we called out last week we got our target on Friday but we still need to wait for a new range to be confirmed as we have not had two 5 minute candles closed below us and row because of this we cannot have any consistent markups until this point is formed we had a big drop off at market close that we need to wait for this to correct itself depending on if we have any gaps at market open we will monitor as market open up.
Remember to always read order flow and follow what price is showing you instead of trading based on your desired direction. And, as always, stick to your risk and your plan.
We'll be closely monitoring market openings and price action throughout the week. If you find this analysis useful, let us know in the comments below and hit the boost button to show your support. Here's to a successful week of trading!

CADJPY 1829 pips long setup (Low Prob)Probability: ~19%
Reward (Target 1): 989 pips
Reward (Target 2): 1422 pips
Reward (Target3): 1829pips
Risk: 44 pips
Risk to Reward: 60 (34for target 1, & 48 for target 2)
Aggressive entry 94.111 // OANDA Feed
Conservative Entry 93.629 // OANDA Feed
Stop loss 93.193 // OANDA Feed
Take profit 1: 103.852
Take profit 2: 108.297 (Classic resistance)
Take profit 3: 111.186 (Ideal Take profit)
Precision of entry: High
Probability of an 800 pips long straddle from current price >50%
White scenario is more favourable than the red scenario

EURCADEURCAD is range bound.
Ranges are good thing to play with , just buy the low and sell the high.
What you people think of this idea?

EURCADIs EURCAD again getting ready for another bullish attempt.? Currently it is getting support from bottom of channel where RSI is also oversold.

USD/CAD. Bullish?The USD/CAD pair appears to be forming a Daily Bias retracement to continue the rally that I expect to continue through the remainder of the week. There is important news at 8:30 New York time, potentially at that time the entry of purchases breaking the lows of the Asian range and rising, a classic Judas Swing movement. The time of the news (UTC-6) appears in the images incorporated into the graph. The harmonic pattern Bat forming in tempralidades of 4h and the daily Bias.
USD/CAD Analysis:
Harmonic Pattern Bat:
Daily Bias:
News:

GOING LONG IN CADJPY | TRADING STRATEGYBearish Indications
1. Lower Highs and Lows
2. Descending Channel
Bullish Indications
1. Already test its significant support
2. Already formed LL after a large red candle and now it will move towards new LH
3. It will go up to test the resistance trend line

Long USDCADDXY Is Going Up to level 109.00
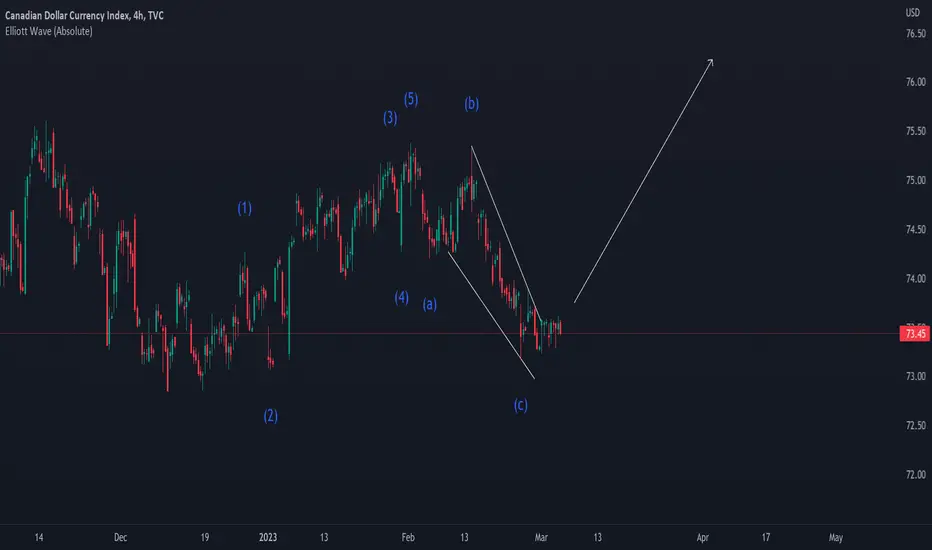
CXY broke out of trend line and going to 76.5
And USDCAD broke the resistance level, now its going to Retest on that level and move up.

Canadian Dollar has bullish momentumRSI channel clearly shows that CAD buyers come in to market every time CXY could not hold its value
Also it shows that CAD has bullish market
Finding currency which is bearish, is great chance to have trade agains CXY

''CXY'' after the break with force of this powerful resistance ''CXY'' after the break with force of this powerful resistance we see that CXY will increase the price
CXY Analysis 04212022CXY Bullish for the next few years. Please watch cross-currency divergence while trading.

CADJPY ABCD reversal harmonic pattern on CADJPY daily time frame is appearing. confirmation will happen when there is apparent reversal from point D

USDCAD, Quasimodo Pattern Bearish(QM), D1A bearish pattern seems to be happening.
The pair is completing the Quasimodo pattern.

USDCAD A Year Rally Going To End!!!After pandemic many things went change. CXY index high DXY dropped and main rule played was zero interest rate as well as Oil prices gave advantage to CAD. Fed admit inflation high and rising interest rate is another tool after QE , Tapering. But other side Stocks feeling fear with Interest rate hike and we can say market on top and near a bubble. Fed said rate hike twice in 2023 but it can come early to control this inflation.


Canadian Dollar Index on Final Peak?CXY rally run after pandemic and clearly can see a big impact of Oil prices , it reached on it's final stage?
Technically we expecting it's down move soon...

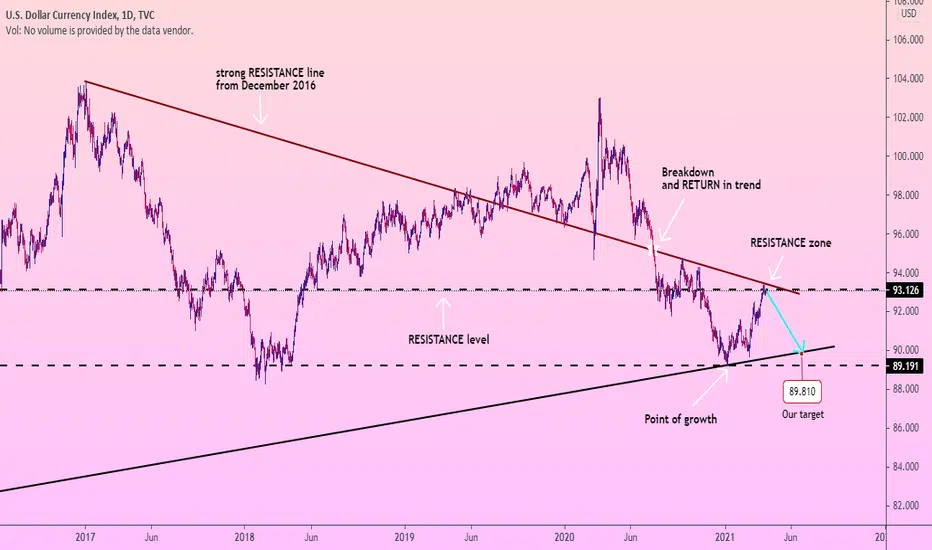
DOLLAR FALL between two strong levelsConsider the price movement on the larger TF to get an idea of the global price movement. We see that from 2016 it began to fall. Then, in 2018, it pushed off the strong support level of 89.19, rallied and was able to break the trend line of resistance 97.73. However, in July 2020 it fell and broke it again in the fall at point 93.21.
After breaking the line, the price also broke through the strong resistance level of 93.12 and finally returned to the level from which it started to rise - 89.19. Now the price is in the resistance zone 93.12, where the 2016 level and line intersect. I expect the price to fall from this level and return to the 89.81 support level. This will be our goal.
Traders, if you liked this idea or if you have your own opinion about it, write in the comments. I will be glad 👩💻
Cad heading into a risky zone The cad bullish momentum is going to be tested within the zone because it heading towards a major resistance zone. This zone has rejected several trends, causing bearish momentum in the past
Now would be the best time to test for the bearish emergence being that the cad is another safety currency. As the market's fears over the viruses ease more the cad might not look as favorable anymore and there could be huge profit-taking and shifting of currency demand.

