[UPDATE BTC] THE LENGTH CYCLE THEORY: WHEN WILL THE END COME? ANOTHER SCENARIO HERE.
FIRST OF ALL, YOU CAN SEE FROM THE VOLUMES AND THE LENGTH CYCLE THAT WE ARE NOT AT THE END OF THE BULL.
CURRENTLY WE ARE IN LINE WITH THE THIRD CYCLE.
THE CORRECT APPLICATION OF THE LENGHT CYCLE SUGGESTS DECREASING RETURNS AND A LONGER TIMELINE TO REACH THE TOP.
HOWEVER, I SEE THREE SCENARIOS HERE, COMBINED WITH OTHER TECHNICAL STUDIES:
A) CONSOLIDATION UNTIL JULY AND THEN BTC REACHES THE TOP DURING THE END OF SEPT. THIS SCENARIO FOLLOWS THE STOCK TO FLOW MODEL, THE HALVING THEORY AND THE CONCENTRIC FIBONACCI INDICATOR. IT DOES NOT FOLLOW THE LENGTH CYCLE (BTC REACHES THE TOP BEFORE CYCLE 3)
B) CONSOLIDATION UNTIL AUG AND THEN BTC REACHES THE TOP DURING THE END OF NOV. THIS SCENARIO FOLLOWS THE STOCK TO FLOW MODEL. IT DOES NOT FOLLOW THE HALVING THEORY, THE CONCENTRIC FIBONACCI INDICATOR AND THE LENGTH CYCLE (BTC REACHES THE TOP IN LINE WITH CYCLE 3)
B) CONSOLIDATION UNTIL JAN AND THEN BTC REACHES THE TOP DURING THE END OF MAY. THIS SCENARIO DOES NOT FOLLOW THE STOCK TO FLOW MODEL, THE HALVING THEORY AND THE CONCENTRIC FIBONACCI INDICATOR. IT FOLLOWS THE LENGTH CYCLE (BTC REACHES THE TOP AFTER THE CYCLE 3)
Let me know what you think.
I LIKE A AND C.
Cycle

BTC is playing this pattern. 20-30k to 144k by EOYWyckoff distribution being played candle by candle.
It's like sorcery, the price action is following Wyckoff distribution.
So BTC may hit a 20-30k as lowest low being 64k a top in the MID term. BTC may do another final top as high as 144k by November 2021; repeating somehow 2013 cycle.
On the other hand this cycle may be prolonged to as far as mid 2022 extending the top cycle which would follow Stock2flow model (higher extended wyckoff distributions-accumulations and diminished maximus returns).
I don't expect bear market or an insane bounce from current price to a new ATH soon.
Most probably scenario is we're near the end of wyckoff distribution and about to enter a final second wyckoff accumulation.
So 144k ATH 2021 EOY or MID 2022. 64k should be a mid term top.
- - - -
This will follow also 12345 ELLIOT wave count after ABC correction being C (20-30K).
NFA.

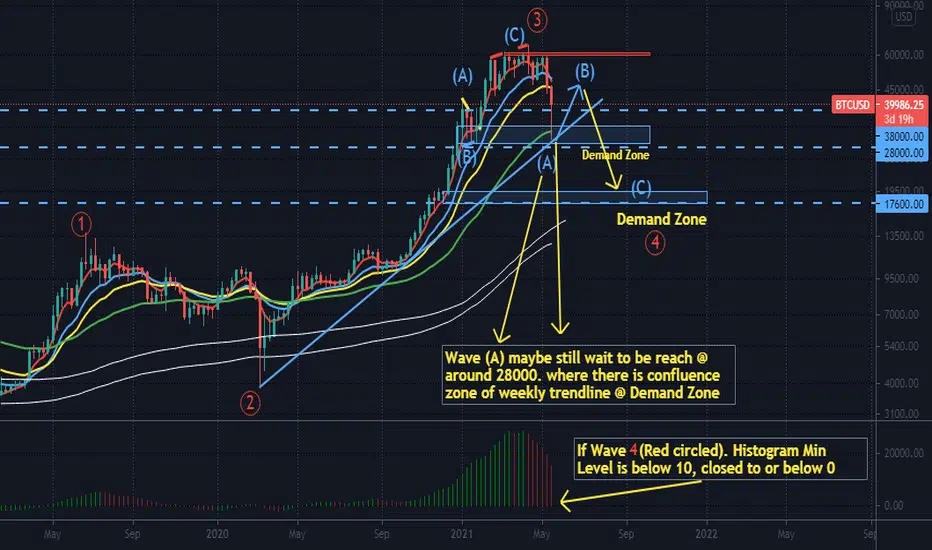
BITCOIN possible ZigZag(A)(B)(C)(cyan) pattern.Updated 20 May 21Based on current lower time frame Bitcoin chart e.g : 1h, 4 h chart.. Bitcoin price may yet need to reach around 28000 to complete wave (A) ( cyan/light blue) of the 1 leg of zigzag (A)(B)(C) wave, instead of previous triangle idea..
GOLD still 1 more leg up toward ≈ 1905. Updated 20 May 21Gold Price upward momentum still strong, next supply zone would be around 1905-1920, watch out for any price weakness around this zone for sell setup.. 1905 will be the intersection of upward pitchfork line / downward pitchfork line and Supply Zone..

GOLD. Last leg up for wave (A)(Cyan) @ ≈ 1888. Updated 19 May 21Gold's price possible still have 1 more leg up toward around 1888 to complete wave (A)( Cyan / light blue) .. For the sake of good Risk/Reward Ratio.. Traders might consider waiting for short setup instead of long..

GOLD Wave (A) (Cyan) possible reached. Updated 18/5/21Gold Price possible reached (A) (Cyan, light blue ).. Price has touched the upper trend line of leading diagonal and price maybe wont reached 1880 on wave (A)..Stop lost @ 1874, Tp @ around 1720...where there is a weekly pin bar (demand zone) and weekly uptrend line meet..

BITCOIN to 20.000$ ? We are on our way en here is why! MUST SEE!Dear traders,
I have prepared an analysis of Bitcoin on the longer term. You can see here Bitcoin with an MACD on a weekly time frame basis and a MACD on a daily basis.
If we go back in time for a moment, we got a sell signal in the weekly MACD on January 25 2018. The price of Bitcoin did not move higher after that but continued to fall with botteming out until October 24, 2018. It was a correction of 82% This was THE time to buy!
The next sell signal of the weekly MACD was on August 30, 2019. The following period we got a correction of 64%. Again the perfect place to buy for longer term!
Currently, we got the sell signal of the week MACD on April 23, 2021.
Compare the chart yourself. The daily MACD is currently NOT showing any positive divergence so this correction is probably going to continue for some time before we see bigger pullbacks. That is ofcourse just a scenario because we are talking here on longer time frames.
Traders, this does not imply that there will be no rebounds. But the long term picture and prices above 65000 can in my personal opinion be forgotten for a longer period.
I understand traders who don't believe this scenario but this is my view on it. I believe Bitcoin will climb to 300.000 $ in the future only it will not go in one line. We do have corrections needed for a stable growth in price.
So According to my personal analysis, with Bitcoin, we can see a possible bottom in the period January to July 2022 with a price target of 20000!
Where and how do I get that number of 20000? First it was a milestone and extemely important keylevel in 2018. It is also the top from now with a 65% correction ( the minimum correction from the last 2 correctiosn). The time is just what happened in the past from the moment the MACD signal was given untill the final bottom and Bitcoin went up again!
That is minimum 6 months and maximum 12 months if and only if history repeats it self. But that is where TA is based on and never forget it does not work always and for 100% but you will have a big edge on traders who don't see the bigger picture!
Guy's as said already, this hypothese is my personal view on Bitcoin. It is not investment advice but a hypothesis that I believe has a very good chance of happening. I respect everyone's opinion even if it is different. That is why there are bulls and bears and the market is always priced correctly because there is as much demand as supply. The market also always comes back to the longer term average. My view on Bitcoin for the long term is very bullish because Bitcoin is only limited in circulation namely 21 million coins can be mined but again that will probably happen from next year only.
Would love to hear your idea's and view on Bitcoin traders. What is your view and most important why! An idea is good but without analysis it says nothing of course.
If you like my work please support it by following me and giving me thumbs up. That will motivate to continue with analysing the charts! Thanks!!!
I wish all of you good trading and profits!

$BTC Reversal Soonit's been a pretty rough time for $BTC and therefore most alts but I believe we will be seeing a reversal very soon. I predict one more dip down into the lower box ($43K-$38K) within the next couple of days (may 19th-ish) and then resume the macro uptrend (may 20th-ish).
hodl a little longer, we all gonna make it.

Projecting Bitcoin 2021 top from projected 2022 Bear market low:Bull market tops and Bear market lows have been lining up on log chart.

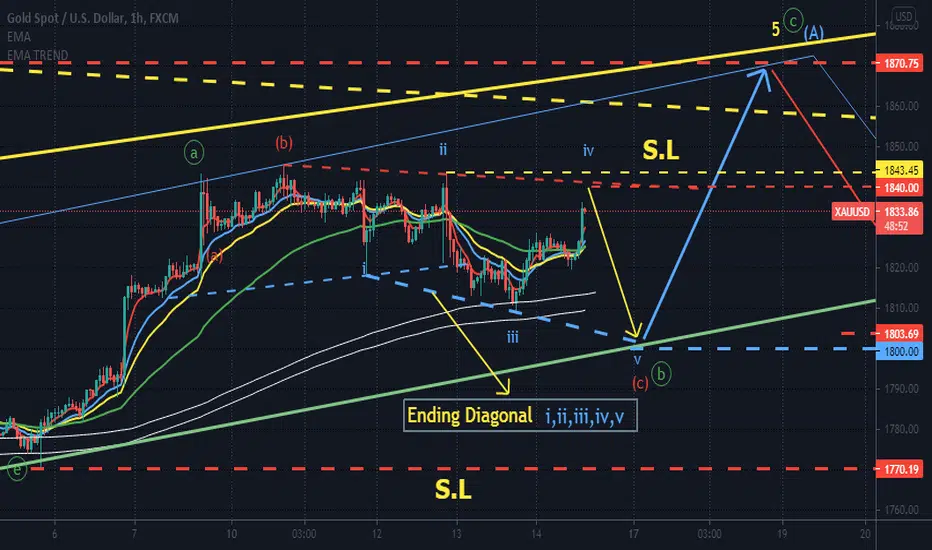
Gold. Ending Diagonal on lower Time Frame. Updated 14 May 21Gold. Short @ around 1840, Sl @ 1844, Tp @ 1800 for Ending Diagonal Pattern i,ii,iii,iv,v ( Cyan, light blue color )...
GOLD. Waiting for price ≈1800. Updated 13 May 21Gold.. waiting for long @ around 1800, where price reside @ lower trendline of leading diagonal pattern / previous resistance/support flip zone..Stop Lost @ 1770 . Tp @ around 1870 where price of of previous supply zone/ upper trendline of leading diagonal pattern intersect...

Reaching Cycle Top (Total-Daily)Looks like this cycles getting close to the top.. will it break the resistance trend? Maybe but I doubt it.
Looks like its going for correction, multiple coins are over extended and overpriced without support.
(I'd buy the dip, Not Financial Advice)
What do you guys think?

What do u see? I still gluing my eye on the "triangle"... Anyone see the "triangle"? Price still in the tight range of within 1845-1820....

Dogecoin Pi Cycle Top IndicatorI read about Pi Cycle Top Indicators on lookintobitcoin.com, but couldn't find one here for Doge. All code credit to BilzerianCandle and his Bitcoin Pi Cycle Top Indicator.

Gold waiting for final leg up wave (A) (Cyan) Updated 11 May 21Just updated my view.. Price of gold still in small range probably forming a triangle of double three pattern within 1825 -1845 tight range before breaking up to 1860 for final leg up for wave (A) ( Cyan/light blue colour) ...cycle analysis shown around 12-13 May 2021 Price will retrace back and having possibility to 1750-1720 zone...

S&P500 Dominant Cycle Topping NowCyclic Tuned RSI based on the current cycle length of ~170days in the S&P500 index show current topping process forming again


GBPJPY wave updated 8 May 2021Wave (iv) (red) "maybe" is a triangle.. Waiting for Final leg up for Flat pattern (w)(x)(y) ( blue/cyan colour ) for wave (4) (red) in weekly /monthly chart.
P/s. Traders should have independent view and strict proper risk management before trading any leverage instruments. without blindly following any trading ideas from others

Bitcoin potencial top cycleHello this is only theory and nothing is sure but i believe we can reach this highs. Most of peoples didn't believe about $50k for march, now they don't believe for $200k and most of them told me here is top. It may be so, but most indicators show me that they are probably not right and the next 3 months will be crazy in price discovery.

Near (Update Analize)Near Anlaize Update and analize 4H Time frame: Consider Sub Wave:
subwave of 1 or a wave is complete, weWe expect wave 2 correction to start
I gusse Wave C of 4 in End wave Cluster so it possible Correction is over.
do not forget use Trigger and look at btc price ditection...
This coin has not had a special price jump in the past, If the channel is broken in the future pump is comming.

Bitcoin - possible end of cycle and decline to 0,62 FiboBitcoin - possible end of cycle and decline to 0,62 Fibo.
I excluded the March 2020 crash and limited to 0,62 Fibo from bottom of Dec 2018 to Jul 2019.

Is the 2021 Bitcoin Bull Cycle over? Decide for yourself.This is a comparison of the bull cycles from 2013, 2017 and 2021. I just overlaid them on top of each other, copying the performance since the halving date.

Bitcoin vs Gold / Gold's Last Dance / Spot the DifferencesBesides time, that is x10 faster on Bitcoin due to technological advancements, better global access to markets and information i see no other major differences. Our future self 30 years from now when we will be around 60-90 will sound to our kids and grandkids as our grandparents and parents right now, BTC is the safe haven!!!
Matter of fact BTC has a bright future ahead but imo the insane bitcoin rush is now gone, it will slowly and gradually replace gold (as global reserve) but first gold has one last dance.
