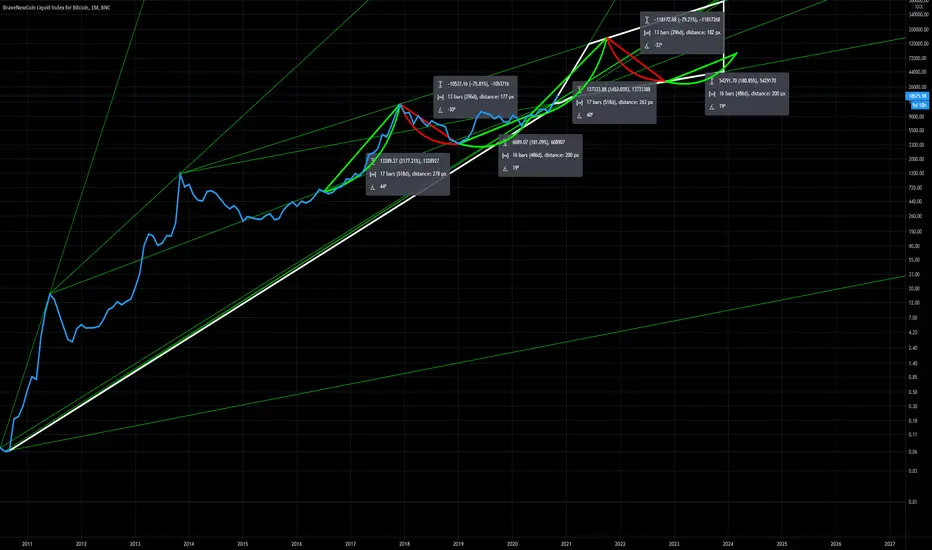
Bitcoin - Aftermath of a Parabolic CycleIt's been a while since I zoomed out and looked at BTC LONG term. With all of the volatility going around I've been caught up in identifying short term signals.
To get a better understanding of what is happening on the chart, move your curser over the anchors. Start from the left and work your way over to the right.
What I have identified over LONG TERM, is that a parabolic cycle has the tendency to return to/just beneath their starting point. It happens within 10-12 months after the top of the parabolic has formed. How do I know this? It has been confirmed 3 times in the past 3 years. The RSI is added for confirmation on the top of the parabolic cycle.
Am I saying we are about to plummet down now? NO
Am I saying that you cannot make money over a 1-year bearish dominant trend? NO
What I am saying is that according to RSI , it is likely that we have reached the top of this parabolic cycle and according to history over a 3 year timespan, there is a HIGH PROBABILITY that over the next few months we will return to the bottom/slightly beneath where the current parabolic cycle started.
Note that short term scalp profiting is possible even in a bearish trend .
Note that we MIGHT go higher in the short term, this chart is focused on LONG TERM.
Best Regards and thank you for watching,
BlockTechEv
Cycleanalysis

*Yawn* Will it consolidate until Feb 2021? - Cycle AnalysisI love MCD. I even love their fries some times.
MCD has done great during the pandemic. But this stock is tired.
NYSE:MCD has seen a decline, while analyst have set a reduced price target of $225.
This is achievable for MCD. But when?
Based on cycle analysis, it would seem MCD's real momentum will only come through by Feb, hitting the price target or higher by March 2021.
The hope, of course, is MCD finds momentum from the shorter cycle (pink surprise arrow tracking this) and jumps back into the yellow channel. This may happen as a build up to earnings. But, most likely, I expect MCD to trade in the white arrows at this stage.
Yellow Channel - This is the stock's trend channel dating back all the way to 2015. MCD should (and will soon) jump back into this channel for long-term growth.
Good luck!

Aww, maybe next cycle AAPL -- 140 in Jan!AAPL has played nicely in the cycle analysis so far. We are only about a week away until the minor dip entry in AAPL.
If you have followed my previous analysis on AAPL, you will see the cycle analysis takes into consideration peaks and dips before the earnings.. Earlier analysis also explains the trend lines, where we would find strong support around $112 for AAPL.
Expecting entry around 116.56 next week.
Exit Mid-Jan, 132-140
Good luck!

BTC bear market starting?I want to share my thoughts about Bitcoin. Probably many people won't like this, that's fine :)
alright,
As you can see, the cycle of 18 months is coming to a end. In my opinion, price could drop towards the $7000 region or maybe even lower. BUT, that doesn't meen that i'm a permabear. No, it IS a healthy correction. in the previous cycles, price also ALMOST made a 100% correction. So why should it now be impossible?
What if price is going to retrace towards the 78.6% fib? Which is falling inline with the long term up trend(line)? For me it makes sense.
I think it's not a bad scenario if we going in to a 8 month bearish market before we sky rocketing higher.
Following these cycles, I think we could see REAL ATH's around May/June 2022.
Feel free to share your opinion with me. Feedback is also welcome!
Thank you!

Bitcoin shows cyclic sell signals on daily and weekly chartsTwo of my favorite cyclical technical indicators show sell signals on the daily and weekly Bitcoin chart.
The first top indicator is a parameter-less ultra-smooth, zero-lag momentum indicator based on the current dominant cycle. The second, bottom indicator is a cyclic smoothed RSI indicator using the current dominant cycle. The main dominant cycle in Bitcoin is currently 268 day. Therefore using a cRSI length on the daily of 67 (4th harmonic ) and 38 on the weekly charts (268/7).
Signals on the chart have been marked with dotted lines and sell/buy arrows when both indicators are in alignment. Buy/sell arrows are synced between the daily and weekly chart.
An interesting alignment is forming right now.
The two indicators are available as open-source versions in the "related ideas" section.

UPDATE Cycle Analysis: AAPL to 140 - Jan 2021? Continuing from my previous idea - AAPL to 140 by Jan 2021.
AAPL hit the $118-120 target on time based on previous analysis -- white arrows.
Few days ago, I had added a yellow path and have just added a blue path as well to track AAPL's movement from here and be prepared for the right entry.
Yellow Arrow Path: AAPL moved up to $120 around 7 days early based on this prediction. The reason I am keeping this track open is because I believe AAPL could still move with this channel if there is some selling taking place early December and based on any pressure from NASDAQ and QQQ in first half of December.
Blue Arrow Path: If bullish momentum continues on December 1 and 2, AAPL could break out of the 120 resistance and soon be testing resistance around 124-126.
Entry timeline: I expect the ideal entry between December 17 to 28 based on which of the three colored arrows AAPL follows.
Ideal Entry Price: I still believe AAPL will likely re-test the Green support line closer to entry timeline suggested. Looking for $112-113 around RSI 39 or below.
Alternative Entry Price: If AAPL sticks only to the blue arrows, the entry may be around $120-121 . Again, I will keep an eye on the RSI touching 39 around here and consider entry on the bounce.
Good luck traders!

Cycle analysis -- MSFT to 260 in Jan 2021?Like my cycle analysis on NASDAQ:AMZN and NASDAQ:AAPL , MSFT has a similar timeline, with only minor differences. Unlike Google and others, MSFT, AMZN and AAPL are yet to hit all-time highs. This seems unlikely in December as we see usually see some selling take place in December. But, very likely that we hit 260 by mid-Jan 2021.
Yellow line: The big resistance based on highs set on Apr 2019, Feb 2020, Aug 2020
Grey line: Initial resistance based on lower highs set on Jul, Oct and Nov 2020
Green support line: This is a key support line from March 2020, tested twice in Nov already. If MSFT breaks below this by December, then we look at the white support line.
Entry: Based on how MSFT plays out in the cycle over next two weeks, entry will be at 206 or 215.5 between 21-28 Dec. This is 37-44 days before earnings call, which is when MSFT has shown to dip lowest before a drive up in recent quarters.
Exit: Around Jan 20-22 at 234-260 high. I may like to hold a few positions until March if the momentum looks bullish and able to test 260 in March instead of Jan.
Good luck traders!

Cycle analysis: BTC to 24000 in 2021Cycle analysis on weekly chart. I expect a bumpy ride ahead with a fair bit of consolidation.
Expected support levels to test: 16,000(most definitely) and 14,000 (likely)
Resistance: 19,500 will remain a resistance unless BTC sees huge bull volume (perhaps needs another big bank confirming their buy-in) before 2021 and we see the new high by Feb 2021. This scenario is possible if BTC does not pullback to 14,000 by December I believe.
Key support:
Yellow support line: Dating back to March 2020 and has been validated as support in September 2020.
Ultimate support:
BTC's ultimate support remains at 5,800 in 2021.This is a very unlikely scenario though.
Green dotted line: Highs from Dec 2017 and June 2019.
Green line: Resistance as June 2016 High, later validated as support on July 2017, Dec 2018, March 2020
Good luck!

Cycle Analysis: AAPL to 140 - Jan 2021? Apple, NASDAQ:AMZN and NASDAQ:MSFT , unlike NASDAQ:GOOGL and others are yet to reach new highs. AAPL, AMZN and MSFT follow a similar cycle and have been aligning nicely with this cycle.
Big Yellow Line: AAPL shows signs of aiming for new highs having broken out of the yellow line set by previous highs of 2 Sep and 13 Oct.
Note that AAPL gaps up on 4 and 5 Nov to break out of this resistance and tests the line as support on 11 and 24 Nov.
Big Red Line: This will be the main resistance for new high. Tested as support on 23 Mar and 24 Jul. Tested as minor resistance on 26-27 Oct and 5 Nov.
Red dotted line: Historic resistance from July 2019 and Jan 2020. This line suggests if AAPL was growing on a normal trajectory (without a covid and stimulus extended market), AAPL could have tested this high by 2021.
Green lines: These two green lines test historic highs and historic lows and align perfectly with entry marking. I love seeing when a number a signs merge together!!
I will test the cycle until entry date now.
Entry: 112.50 around December 21. Based on cycle analysis, 41-45 days before earnings shows a dip buy opportunity for AAPL
Exit: AAPL peaks 15-17 days before Earnings. Low price target - 131 (half position sold) . High target - 140
Good luck traders!

Cycle analysis -- AMZN New highs by Jan 2021?Amazon (similar to AAPL and NASDAQ:MSFT ) has been flowing with the cycle nicely.
The line to watch is the Green support line
Green line: Tested as support from 10 Nov, 21 Sep, 29 Jun. Acted as resistance on 20 May, 16 Apr.
Entry: 17-21 Dec at Price 3,150
Exit: 3,580
Waiting to confirm cycle pattern.
I also note that Amazon has peaked approximately 17 days before earnings. This is the approximate timeline of exit.
Good luck!

BLX Bitcoin Halving Cycle 2020-2024Just an idea of the range where Bitcoin could go on long term, based on halving cycles.

Good entry -- will ride it until Feb earningsSitting nicely with the weekly cycle.
I would make a small entry at current price.
A further entry if drops to $240s range.
Main exit = $ 277
Small hold until Feb 2021 before earnings.
Please share thoughts --always learning :)

Natural Gas - This chart could be worth a million bucks Please observe this cycleanalysis. It's all pointing out that this market is about too take off.

Bitcoin SV 200%+ in less than a month
BSV seems to be what is a third cycle of a pump and dump.
Using history of the 2 other cycles, it seems that BSV dips 3 times before making a major pump and dump.
Using the MacD it seems that we are on the 3rd dip meaning we will go up soon.
My price target is 630- 700 using fib retracement.
Stop loss is set at 200 for a risk reward ratio at about 27. Using fib time, we will hit this target on September 7th.
!LET'S NOT FORGOT THE INCOMING GOLDEN CROSS ON THE DAILY CHART!

#AUD/NZD AnalysisThis Pair has entered a New Bullish Ascending Channel after a lot of Compression by Sellers. Buyers have pushed the price upward and broken the 1.0700 Resistance Level.
Price is currently at 1.0800 Resistance Level and has hit the Trendline Resistance. So we have two types of Resistance at this point. Horizontal Resistance & Trendline Resistance.
Trade Idea:
This is a Bull Market, So only look for Buys. Wait for the Price to fall to the 1.0773 Support level which is also a Fibonacci Support level. Then enter for a Buy (Go Long).
First Target TP is 1.0822 level.
Second Target TP is 1.0875 level.
Use Good Risk Management and don't forget to set a Stop Loss.

BTC Projections and Cycle Top AreasChart inspired by Benjamin Cowen. Instead of logarithmic regression, I am using simple fib channels, 50 MA, 200 MA, and the SMS indicator courtesy of Nicholas Merten. Looking for $100K BTC by the end of 2022.

Seasonal Long from June rotation into August $DJI $DIAThe end of month rotation of June is upon us. On Friday June 26 we witnessed some very interesting rotations into small caps, cyclicals, and silver.
If the virus news does not overwhelm the markets (big players control the news flow) then we have a good possibility of moving up toward the Independence Day holiday and beyond toward the next FOMC in July.
The big push comes after that FOMC statement on average and we get a rally in bonds, stocks, gold and silver.

Seasonality Long from the June rotation into August $DJI $DIAThe end of month rotation of June is upon us. On Friday June 26 we witnessed some very interesting rotations into small caps, cyclicals, and silver.
If the virus news does not overwhelm the markets (big players control the news flow) then we have a good possibility of moving up toward the Independence Day holiday and beyond toward the next FOMC in July.
The big push comes after that FOMC statement on average and we get a rally in bonds, stocks, gold and silver.

Bitcoin to $1000000 by Q3 2021? Vibrational AnalysisOkay this is too good to be true, but charts seldom lie.
Applying the principles of vibration to the Bitcoin market, it is quite evident that the price of Bitcoin is aiming 1 million by Q3 2021. However it is hard to personally believe this, so sharing this analysis for the community's feedback.
Time Cycle - 34 Days and 5 days gap for the next cycle to begin.
Equilibrium of BTC vibration - Ascending
Equilibrium of USD (DXY) vibration - Descending
The only way Bitcoin goes to 1 million is when the money starts leaving fiat. It is indeed a brave new decade in a brave new world. The possibilities are endless.
What do you guys think?

Bitcoin to $40000 by August? Time cycle of 34 days is perhaps most important to Bitcoin I have found. And it has been giving gaps to the multitude of 5 days before changing from one cycle to another.
As per the current cycle we are in and the important fundamental of compulsory retest, this curve is awaiting a retest, which makes me predict a high of 40k by August. Along with the angles of 156, 146, 138, 131, 119, 106 originating from this very point which are acting as clear lows or acting as resistance for further dump.

DXY H1-H4: buy stop 99.40 SL 99.0 TP 100.50Stay bullish till a middle of June (calculated forecast curve might be provided by personal request)

AUDUSD H4-D1: sell stop 0.6550 SL 0.6650 TP 0.6000Stay bearish till 10th of June (calculated forecast curve might be provided by personal request)
