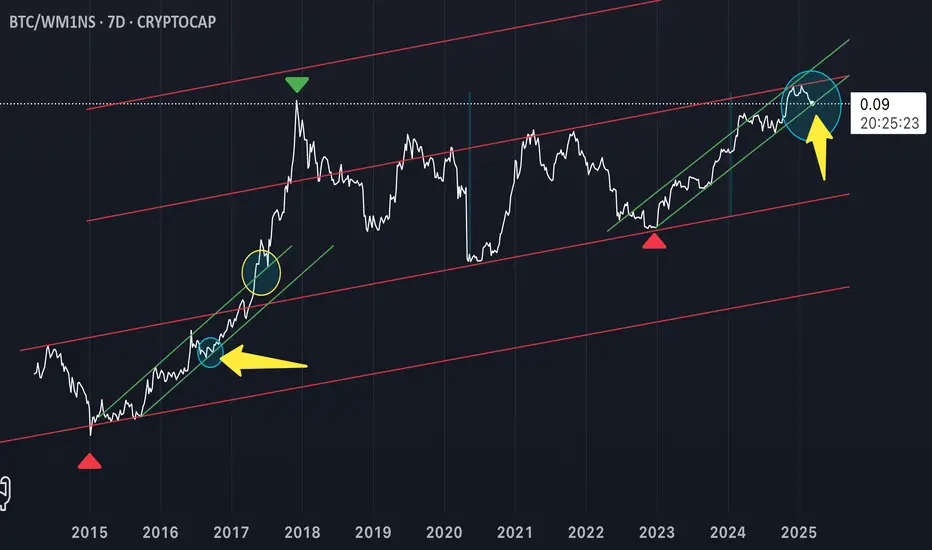
Where is Bitcoin?Squawk! Currently Bitcoin is at the 2nd yellow arrow! Compare to the first arrow for the roadmap my Squawky friends!
Cycles
EURUSD (Cycles)EURUSD Moving on the channel. I showed the cycles (about 4 year cycle). Need touch to resistance line of the channel (50-61.8% level fibonacci). After that, I must show the minimum of this cycle. Most likely it will be in 2018. This will be accompanied by a strong strengthening of the dollar

Bitcoin Long Term - 4 year cycle / fractal I really need to spend more time before publishing....
Here's is my updated chart after tidying it up, adding a few bits and also a tongue in cheek look ahead to $1,000,000 :)
Bitcoin 4 year cycle, self explanatory chart.

Sell the News into Bear Market LowsCXs conservative target is about $200k. (right now).
But the consensus is always wrong.
Last cycle everybody was sure about 100k (minimum).
What did we get? 69k.
So 69% lower than expected. (nice).
I unironically think that that's a good metric for estimating tops in crypto.
So 69% of 200k would put us at around $138k.
Talks about "Supercycle", "Hyperbitcoinization" and "Valhalla" getting louder and will most definitely await us once our crypto savior Trump will be inaugurated.
In other words: The biggest Top Signal ever about to hit the market.
IMO Perfect Sell the News Event for the big guys.
Especially after the psychological 100k is breached and retail panic buys.
Macro is also "not looking good bruv"– That's why I think the cycle will be cut short and a painfully long Bear Market awaits us with the lows possibly 20% lower than 2021 ATH hitting around November 26. Before that we might get a second chance to sell high with a Dead Cat Bounce.
FYI: I don't short, I don't long, I'm mapping this out for me to not get caught up in euphoria, sell around the highs and to catch the next lows.
Good Luck Have Fun !

Bitcoin Cycles ChartThis chart highlights the remarkable consistency in Bitcoin's historical cycles, showcasing how price movements align across different cycles in terms of duration (days) and percentage changes. By visualizing these repeating patterns, you can gain valuable insights into Bitcoin's cyclical behavior and potential future trends.

Bitcoin cycles since 2011Each crypto cycle lasts about 4 years. The tops and bottoms of these cycles show striking similarities, often following a pattern that has repeated over the years. This isn't just coincidence—there are underlying factors that contribute to this consistency, making it vital to recognize these patterns in your trading strategy.
If history repeats itself, we are looking for this cycle to top around 20 Oct 2025 with next low around 14 Sept 2026.
It will be a wild ride. Buckle up!

BTC cyclesEach two years in December BTC starts a new cycle. If everything go with the same plan, now we are at the beginning of growing cycle.
P.S. Hidden it from the chart, but for your information 21 EMA is at ~7100 - important value.

Finish him #5On the chart, you will see a parabola of the last wave in this cycle, and the approximate end time.
I will also post the average growth price, according to my theory, the price will go around it.
Hope and do it.

Bitcoin Cycle Accumulation Zones -150W & 200W SMA Bitcoin Cycle Accumulation Zones -150W & 200W SMA
KEY CHART ITEM LEGEND
* TEAL LINE (LIGHT BLUE) - 200D SMA
* AQUA LINE (DARK GREEN) - 600D SMA
* GREY LINE - 150W SMA
* NAVY (DARK BLUE) LINE - 200W SMA
* Navy Box - Re accumulation Zone Time Frames
Historically during BTC cycles as measured from Bitcoin halvings, investor sentiment reaches over sold levels which have attracted long-term accumulation by investors.
We have observed so far in each cycle once the cycle All Time High (ATH) has been set in for BTC, price has become range bound and squeezed between the 200D SMA and the 600D SMA (see post 'A Critical Analysis of the 200D (Aqua) & 600D (Teal) SMA').
A CRITICAL ANALYSIS OF THE 200D (AQUA) & 600D (TEAL) SMA
Once BTC has broken the 600D SMA, price migrates to the 150W SMA and eventually the 200W SMA which price then becomes range bound. This area for Cycle 1 and Cycle 2 have shown great accumulation opportunities for long term investment.
In each cycle to so far, the 150W SMA and the 200W SMA have done a good job at identifying this accumulation zone. These accumulation zone and the time in days we have spent in them for Cycle 1 and Cycle 2 are shown below and identified via the Navy Blue box in respective posts.
CYCLE 1 Accumulation Zone - Period ~ 291 Days
CYCLE 2 Accumulation Zone - Period ~ 131 Days
RE ACCUMULATION ZONE TIME FRAMES ANALYSIS - CYCLE 3 DUBIOUS SPECULATION
Observable in each cycle, we are seeing the time spent in the accumulation zone is diminishing each cycle (Cycle 1 = ~291 Days & Cycle 2 = ~131 Days).
In our current Cycle (Cycle 3), we are currently very close to the 150W SMA (wicking into it by not closing a daily or weekly candle below it on some exchanges).
Dubiously Applying the same parentage decrease to Cycle 3, we can expect if and when we enter this zone between the 150W and 200W SMAs again we could stay in this zone for 72 days.
It is worth noting that we entered this twice zone in Cycle 2 (wicking down to the 300W SMA - not shown) due to the COVID dump, and that the above analysis considers only our time spent in these zones that have also coincided with our cycle bottoms.
The COVID dump entry into this zone corresponded to 42 days. Worth noting this is considerably less than the estimated time extrapolated above of the next entry of 72 days (hence dubious at best), but it could also be considered a false entry with this analysis due to the abnormal affect COVID had on market cycles ('Black Swan Event').
If we consider the second entry into this zone in Cycle 2 during the COVID dump as valid, then applying the same % difference method from these two occurrences we could expect our next entry in the current cycle (Cycle 3) to last ~28 days.
Considering the above dubious calculations, then we could estimate the next time we enter this accumulation zone we may spend between ~28 to ~131 days range bound before breaking out of the zone.
Please use the content of this post for educational purposes only and feel free to comment your thoughts on the above below (not financial advice).

Next Crypto pump cycleAs we reach the end of the BTC pump cycle we need to assume that it will follow what it done in the past:
1) the pump
2) the top
3) the fall
4) the stumble back up
5) the emotional pain
Right now we are in the final part of the 4th stage before we get a year or two of crappy prices.
Each time we've reached the top its been followed by a 70-80% decline right now we are only down 30% from ATH so according to my predictions and previous pump cycles we are due another 40-50% decline.
Best case scenario
It will take 475Days from the all time high which is around August 2022 for new bullrun after a 65% drop
Worst case scenario
It will take 475Days from the all time high which is around August 2022 for new bullrun after a 71% drop

BTC insight, BTC,FED,DXY,GOLD correlations New iteration of fed balance,gold,dxy correlations -for clarity added fed total balance as line to the chart,candles for dxy and gold, text info on the chart. Currently gold vs dxy looks still very very 2013 - but even if it's 2013 - this can take time to resolve completly.
s3.tradingview.com if we go further in time with gold and dxy - since 2003 fed balance sheet has been increased by 1000% - last time we had 2013 bullmarket we got increase 500% from start - this is exactly when dxy crossed up again and gold was weaker. this year if we messure from that date up to now (if the indicator is right) we got same amount of increase % wise.

A Picture is worth a thousand wordsNot Financial Advice:
Interesting observation that price tends to be encouraged off the 147 line. Doesn't like to stick around for long, will be interesting to see if this time is any different.


Bitcoin Analyze (Similar Movements ❗️❓)⚖️In this post, I tried to use from Pi Cycle Top Indicator for finding similar movements between two cycles, First cycle:2013-2014-2015 , Second cycle : 2020_2021_2022 .
🔅 Indicator Overview 🔅
The Pi Cycle Top Indicator has historically been effective in picking out the timing of market cycle highs to within 3 days.
It uses the 111-day moving average (111DMA) and a newly created multiple of the 350-day moving average, the 350DMA x 2.
Note: The multiple is of the price values of the 350DMA not the number of days.
For the past three market cycles, when the 111DMA moves up and crosses the 350DMA x 2 we see that it coincides with the price of Bitcoin peaking.
It is also interesting to note that 350 / 111 is 3.153, which is very close to Pi = 3.142. In fact, it is the closest we can get to Pi when dividing 350 by another whole number.
It once again demonstrates the cyclical nature of Bitcoin price action over long time frames. Though in this instance it does so with a high degree of accuracy over the past 7 years.
🔴I was able to find 5 similar movements between two periods and according to my counting waves (My previous posts), I think that the sixth movement at cycle 2 will happen like cycle 1 .
What is your idea about these movements ❗️❓
Do not forget to put Stop loss for your positions (For every position you want to open).
Please follow your strategy , this is just my idea, and I will be glad to see your ideas in this post.
Please do not forget the ✅ 'like' ✅ button 🙏😊 & Share it with your friends, Thanks, and Trade safe

UPDATE: Stocks seeking a year cycle low. Stocks are overdue for a year cycle. After the year cycle low is printed stocks will start a new year cycle. Note that the new year cycle starting will be in the context of the credit cycle correction. This will cap how high stocks can rise until the credit cycle correction is completed.

BTC Its at a major decision area RN, Bull or Bear?BTC has has hit the area of long term support from way back as far 2019.
Is this a retest of the break thru of the trend line below, only to continue on its almost 5 month old down trend?
Will it break thru & follow the trend line as support to go for new all time highs?
Also the area we are currently at is a major support & resistance zone for the last 12 months, as per the red arrows on my chart.
Institutions are buying & hodling lge amounts of BTC & other cryptos.
When you take a lot of selling pressure of the exchanges it means price can rise a lot more easy with fomo.
Also this can mean that a bottom of a bear cycle can not drop as previous ones, "Unless institution's take profits".
Things to consider are the current stocks selling & nerves ATM.
Economic conditions in the USA.
A possible Russia / Ukraine war that could drag the USA & rest of the world into.
This bull run has over extended with time as per other bull cycles.
Are we in a bear cycle until next halving aprox March 2024.

Market Moves in 3's and 7's (extended chart version) ETHEREUMPlease observe the red and blue lines. Notice that the market moves in increments of 3's and 7's within various time scales. These numbers are sacred and biblical by the way. Anything that has been given to you, has been given by the grace of our creator.

Market Moves in 3's and 7's ETHPlease observe the red and blue lines. Notice that the market moves in increments of 3's and 7's within various time scales. These numbers are sacred and biblical by the way. Anything that has been given to you, has been given by the grace of our creator.

BrentCrudeOil maybe around 125? 5/Feb/22UKOIL aka Brent Crude Oil maybe on its last leg up toward around 125 ::- a major supply zone .. AND maybe the terminal of Wave 2 (Red Circled) which is possible an expanding flat pattern..

BTCUSD Monthly - Coppock Curve = The Perfect Buying IndicatorWhen Will I See You Again? and Patience is a Virgo
TL; DR - waiting for the Coppock Curve indicator to hit 0 on the monthly chart has proven to be an excellent move so far for long term buying of BTC.
What is the Coppock Curve indicator?
+ Coppock, the founder of Trendex Research in San Antonio, Texas, was an economist. He had been asked by the Episcopal Church to identify buying opportunities for long-term investors. He thought market downturns were like bereavements and required a period of mourning. He asked the church bishops how long that normally took for people, their answer was 11 to 14 months and so he used those periods in his calculation.
+ The indicator is designed for use on a monthly time scale. It is the sum of a 14-month rate of change and 11-month rate of change , smoothed by a 10-period weighted moving average .
+ A buy signal is generated when the indicator is below zero and turns upwards from a trough. No sell signals are generated (that not being its design). The indicator is trend-following, and based on averages, so by its nature it doesn't pick a market bottom, but rather shows when a rally has become established.
Here is another idea I published back in Jan 2019 regarding BTC and the Coppock Curve (click to open):
Any counter arguments or praise for my ego, please leave in the comments below. Thanks for reading.

GOLD short term updated 3/Feb/221)On Charts : Charts consist of 3-Dimensions - The X-factor ( Time or Cycle ), The Y- factor ( Price Geometry ), AND The Z-factor ( The Speed ).. 2)On Elliot Wave / Market Structure : Unlike Textbook written rule : ALL Impulsive wave comprise of ONLY a-b-c sub-waves NOT 1,2,3,4,5 waves.. AND there is NO Truncated 5th wave BUT ONLY wrong wave counts...

GOLD's 1830 -The Chu Line Separating the bull & bear. 28/Jan/22GOLD's 1830 -The Chu Line Separating the bull & bear. 28/Jan/22.. GOLD's price may found its temporary "base" for wave i (cyan) @ around 1790..Where 1790 are : 1) POC of volume profite 2) Demand Zone 3)Up trend line support. As we're catching the "falling knife".. Traders may have to "reduce" their position size to at least 1/3 of "normal size" as trading against current "down trend".

GOLD on last leg up for expanding flat (a)(b)(c)(Red). 26/Jan/22P/S. There is NO Alternative waves counts BUT either 1 and ONLY "Main" wave counts or "Wrong" waves counts.... Gold probably on the last leg up for the wave (c)(Red) Impulsive move since 15 Dec 2021 which is also the last leg of an expanding flat (a)(b)(c)(Red). Assuming the waves/ expanding flat pattern is valid. Price of GOLD "should be" Capped "Below" -- 1876.95 !!!
