Cyclical Stocks vs Non-Cyclical Stocks: How Can You Trade Them?Cyclical Stocks vs Non-Cyclical Stocks: How Can You Trade Them?
Not every stock is created equal. One of the biggest distinctions is cyclical vs non-cyclical—those that grow or decline alongside economic conditions and those that are less sensitive. In this article, we explore the key differences between the two, how to analyse both, and how to trade them.
What Are Cyclical Stocks?
Cyclical stocks are those that rise and fall in line with the broader economy. They’re more sensitive to consumer spending and include those in the travel, automotive, construction, and luxury goods sectors.
Simply put, when consumers have more disposable income, they’re likely to buy new cars, travel abroad, or invest in home improvements. Demand boosts corporate earnings and pushes share prices higher. However, when consumers have less money or face economic uncertainty, they reduce and delay spending on these discretionary purchases, dampening company earnings and stock valuations.
Nike and Starbucks are good examples here—both are cyclical companies that see higher demand when consumers are in a stronger financial position and feel comfortable purchasing brand-name clothes or buying coffee on the go.
Cyclical stocks tend to be more volatile than non-cyclical ones. Their sensitivity to cyclical business conditions offers potential opportunities for traders to capitalise on a growth phase, but timing matters—getting caught in a temporary or prolonged downturn can lead to sharp drawdowns.
Cyclical Sectors
- Automotive
- Airlines & Travel
- Luxury Goods & Apparel
- Construction & Materials
- Banking & Financial Services
- Technology & Semiconductors
- Restaurants & Entertainment
- Retail (Discretionary Spending)
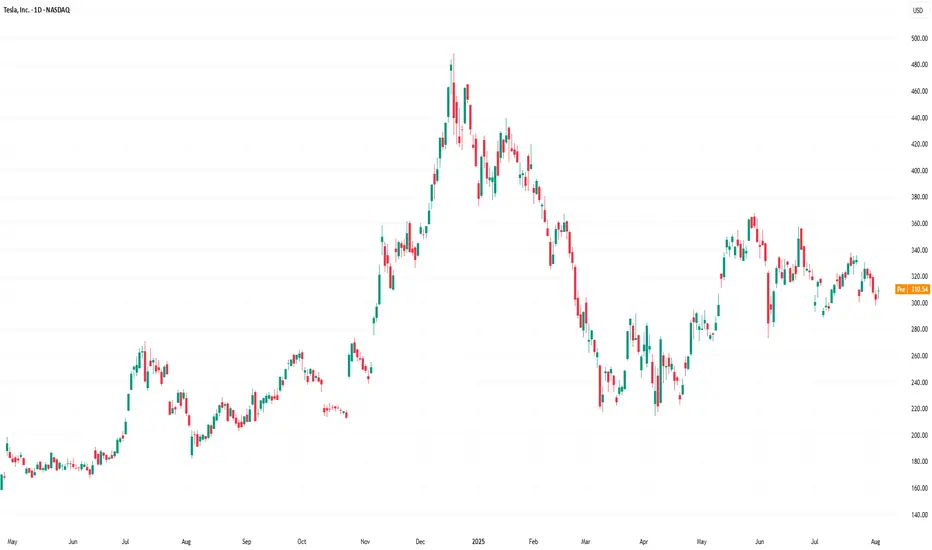
Is Tesla a Cyclical Stock?
Yes, Tesla is a cyclical stock. Demand for electric vehicles moves in line with economic conditions, consumer spending, and interest rates.
Is Amazon a Cyclical Stock?
Amazon is partly cyclical. Its retail business depends on consumer spending but its cloud computing division (AWS) sees constant demand and provides diversification.
What Are Non-Cyclical Stocks?
Non-cyclical stocks belong to companies that sell essential goods and services. Contrasting with cyclical stocks and their sensitivity to consumer spending, non-cyclical companies sell things people buy regardless of economic conditions. They’re often referred to as defensive stocks because they tend to hold up when the economy weakens.
Non-cyclical sectors include healthcare, utilities, and consumer staples. Supermarkets, pharmaceutical companies, and electricity providers see relatively steady demand because people still need food, medicine, and power whether the economy is growing or contracting.
For example, consumer non-cyclical stocks, like Procter & Gamble, which owns brands like Oral-B, Charmin, and Gillette, continue to generate revenue year-round because consumers still buy everyday household items. The same goes for Johnson & Johnson, which sells medical products that hospitals and pharmacies need.
Compared to cyclical stocks, non-cyclical stocks are usually less volatile because their earnings are more consistent. While their potential returns are relatively limited vs their more growth-oriented cyclical counterparts, non-cyclical stocks are believed to not dive as sharply during a downturn.
Non-Cyclical Sectors
- Consumer Staples (Everyday Goods)
- Healthcare & Pharmaceuticals
- Utilities (Electricity, Water, Gas)
- Telecommunications
- Grocery & Essential Retail
- Defence & Aerospace
How Traders Analyse Cyclical Stocks
In a market where going long or short volatile cyclical stocks is an option (such as with CFDs), many prefer to trade them over non-cyclical stocks. More broadly, traders analyse a few key indicators to determine whether cyclical stocks are in a growth phase.
Macroeconomic Indicators
When GDP expands, businesses and consumers spend more, and free-flowing spending boosts demand in cyclical sectors. Similarly, interest rates determine spending on more big-ticket purchases, like cars, homes, and luxury goods. Lower interest rates encourage borrowing and vice versa.
Employment rates also play a key role. More layoffs and a higher unemployment rate mean consumers dial back purchases of discretionary goods and services. Employment conditions, along with economic and policy uncertainty, drive consumer confidence. When optimism is high, cyclical stocks often rally.
Earnings Trends & Sector Data
Unlike non-cyclical companies, cyclical firms see earnings fluctuate based on economic cycles. Traders pay attention to quarterly reports and especially forward guidance. If a company expects strong sales growth due to rising demand, this can drive its stock price higher and possibly signal an upswing in the sector.
Industry-specific data, like auto sales figures or airline bookings, is also a useful gauge for assessing the future performance of a company.
Market Sentiment & Seasonal Trends
Cyclical stocks are prone to seasonal patterns—retailers surge in the holiday season, while travel stocks perform well in summer. Market sentiment is another important factor; for instance, if economic uncertainty is growing but investors on the whole believe it to be a temporary blip, then cyclical stocks may still rise.
Analysing Non-Cyclical Stocks
While traders often favour cyclical stocks for their higher potential returns, many still turn to non-cyclical companies as a possible form of short-term defence against downturns, to balance a long-term portfolio, or when unique occasions arise (earnings reports, company-specific news, etc.).
Earnings Stability & Cash Flow
Since non-cyclical companies sell essential goods and services, their earnings tend to be more consistent. Traders look at revenue trends, gross margins, and free cash flow to assess a firm’s ability to generate relatively steady income. Consistent earnings—even during downturns—can be a marker of a strong non-cyclical stock.
Dividend History & Payout Ratios
Many non-cyclical stocks pay dividends. That makes them attractive for those looking for income-generating assets. A company with a long track record of consistent or growing dividend payments is often a sign of financial strength. The payout ratio (dividends paid as a percentage of earnings) is another metric traders examine—too high, and it could indicate unsustainable distributions.
Market Conditions & Defensive Rotation
If economic uncertainty rises, investors will generally shift into defensive sectors like healthcare, utilities, and consumer staples. Many will monitor fund flows—where institutional money managing exchange-traded funds (ETFs), mutual funds, and large portfolios is headed—to understand if risk aversion is growing.
Likewise, outperformance in certain sectors can be a signal. If sector indices like the S&P 500 Consumer Staples Index or the S&P 500 Healthcare Index outperform the overall S&P 500, it may indicate capital moving into non-cyclical stocks.
Trading Cyclical and Non-Cyclical Stocks
Now, let’s take a closer look at how traders engage with these stocks.
Short-Term Trading
Short-term traders generally focus on stocks or sectors expected to move over hours or days. One strategy might be to examine the broader conditions and trade ahead of earnings reports. If summer is approaching and the economy is doing well, Delta Air Lines could rise in the weeks before an earnings release as traders anticipate strong quarterly performance and positive forward guidance.
Another strategy is trading macro themes. If inflation rises, traders might focus on companies with strong pricing power, like consumer staples firms that can pass costs onto consumers. If economic data points to a slowdown, they might focus on healthcare stocks.
Medium-Term Trading
Medium-term traders take a broader view and typically adjust their portfolio weightings based on economic conditions. During expansions, they may overweight cyclicals like construction and travel stocks, while shifting into non-cyclicals as recession risks grow. That could mean just rebalancing a collection of ETFs, over/under-weighting a set of stocks, or a mix of both.
Here, the focus is usually on broader economic trends while also staying alert for possible strengthening or weakening consumer demand.
Long-Term Trading
Long-term traders often hold a mix of cyclical and non-cyclical stocks to maintain a balanced portfolio across economic cycles. While they may still adjust weightings over time, they tend to be more concerned with long-term sector trends and income generation.
With a longer time horizon, these traders may be more willing to allocate more capital to cyclical stocks during a downturn, especially to otherwise strong companies or sectors, to take advantage of potential rebounds months down the line.
The Bottom Line
Understanding the difference between cyclical and non-cyclical stocks is fundamental to trading them. Careful analysis—macroeconomic, sectoral, and company-specific—can help traders identify potential opportunities across all time horizons.
FAQ
What Are Examples of Cyclical Stocks?
Cyclical stocks include Tesla (TSLA), Delta Air Lines (DAL), Nike (NKE), Caterpillar (CAT), Marriott International (MAR), and Ford (F).
Which Industries Are Most Cyclical?
Highly cyclical industries include automotive, airlines, hospitality, construction, luxury goods, and consumer discretionary retail.
Is Coca-Cola a Cyclical Stock?
No, Coca-Cola is considered a non-cyclical stock. Demand for its wide range of products remains stable regardless of economic conditions.
Is Starbucks a Cyclical Stock?
Yes, Starbucks is a cyclical stock. Coffee purchases aren’t essential, so demand fluctuates based on disposable income and consumer confidence.
This article represents the opinion of the Companies operating under the FXOpen brand only. It is not to be construed as an offer, solicitation, or recommendation with respect to products and services provided by the Companies operating under the FXOpen brand, nor is it to be considered financial advice.
Cyclicals
Can $ALB Triple Without Lithium Prices Hitting All-Time Highs?🧠 TL;DR
Albemarle ( NYSE:ALB ), a global lithium heavyweight, has seen its stock price collapse over 70% from its 2022 highs, closely tracking the decline in lithium spot prices. With lithium carbonate plunging from ~$80,000/ton to under $15,000/ton, many investors assume a rebound in the commodity is a precondition for a meaningful recovery in $ALB.
But what if that assumption is wrong?
This post explores whether Albemarle can stage a powerful comeback even if lithium prices remain far below their peak. Once lithium bottoms—potentially soon—investors can begin extrapolating annual demand growth and embed those expectations into the share price, setting the stage for a valuation rerating.
The headline chart tracks the long-term price relationship between Albemarle and lithium carbonate, normalized and plotted on a logarithmic scale. It shows the synchronized peaks of 2022, the ensuing crash, and where that correlation may have decoupled.
While the lithium price collapse has been severe, NYSE:ALB has arguably overcorrected — potentially pricing in a long-term depression in lithium that may never materialize.
🏭 Revenue, Net Income, and Lithium
This chart juxtaposes Albemarle's trailing revenue and net income against spot lithium prices. Despite a sharp fall in the commodity, the company posted two successive quarters of profitability, and revenue remains well above pre-boom levels.
This resilience suggests:
Multi-year pricing contracts offer insulation from spot volatility
Cost structure remains profitable even at current prices
Demand tailwinds (EVs, grid storage) are still pushing through
📊 Negative Forward P/E, Positive Earnings, and Discount to NAV
While forward P/E metrics have dipped into negative territory, this doesn’t tell the full story. The company delivered back-to-back profitable quarters, and the current share price reflects a significant discount to estimated net asset value.
The market is currently punishing ALB based on trailing pessimism and collapsing sentiment, rather than forward fundamentals. When lithium prices stabilize, even at mid-cycle levels, investors may reprice ALB based on future earnings potential and hard assets—not backward-looking assumptions.
🔍 Key Takeaways
🔋 Demand Remains Strong
EVs, grid storage, and electrification trends are not slowing. Lithium demand is projected to more than triple by 2030. Even modest demand growth off the current base will stretch supply chains, especially if new projects are delayed.
🏗️ Albemarle’s Structural Edge
With a relatively low cost of production and long-term contracts in place, ALB is positioned to ride through the downturn. The company has already demonstrated profitability at today's prices.
📉 Valuation Compression = Opportunity
At current levels, the stock appears to price in a scenario of sustained low lithium prices and declining demand. But the company’s hard assets, cost advantage, and future demand curve suggest a different reality.
🧠 Final Thought
Once lithium prices bottom—maybe relatively soon—investors can begin to extrapolate the rate of annual growth and embed those expectations into the share price, potentially triggering a sharp re-rating before spot prices ever return to their highs.

Simple short - VFC Corp - Long term head and shouldersVFC is a corp that not only is showing a wonderful long-term topping pattern. It's also positioned in a rather poor manner for the current macro environment. They are a cyclical company that sources the majority of their products from Asia, experiencing significant supply issues that are constricting margins significantly.
Not sure if this breaks immediately, based purely on probability, it will likely confuse people and trade sideways around the neckline for a while. But if market conditions continue, it may just break straight through and potentially retest significantly later.

Blackrock at key supportAs you can see, the price has respected the 200sma (blue) since the break from Covid lows.
Risk-reward-ratio presented is interesting as you will figure out if you are right or wrong pretty quickly; especially since the Bollinger bands have been contracting as we have consolidated.
Trade setup:
Target around $1000 for profit-exit.
Loss-protection exit 1-2% under the 200sma.
Fundamental Analysis '
- The $TNX (interest rates) has broken out which is positive for financial institutions.
- There is a cyclical tilt to the market as high valuation companies in the technology sector are hit hard.
* Note: Earnings are starting at the end of next week for the financial sector.

US30 Hourly Pulls Back to SupportThe US30, FXCM’s DJI CFD, is in the bullish area on the daily chart on the left. We note that the hourly has pulled back to support (green shaded area). If price bounces from here, a bullish cross of EMAs and stochastic potentially align short-term traders with the daily. If signals occur, movement of stochastic to 80 level, and maintenance of that level, increases the chance of a successful trade. Trend following indicators may be useful in this case as a potential exit tool. Stop under hourly support in conjunction with risk management techniques. Please note if holding overnight, rollover charges may apply .
