USDCHF potential bearish cypher patternOn the 4-hour chart, USDCHF stabilized and rebounded in the short term, and bulls have the upper hand. Currently, we can pay attention to the upper 0.9104 area, which is a potential bearish cypher short position, and the downside target is 0.9030, 0.8985.
Cypher

VARAUSD - IMPORTANT!! Order Flow Tutorial & Cipher B ReviewIf everyone could please watch and listen to this lesson, I go over in greater detail how to record order walls and how to determine which ones are substantial.
At the end the video stopped, what I was going to say was that each time you swing out 10% of your holding, if you are in a loss position, after 10 times your exchange will record your losses for the write off while at the same time you are increasing your holdings or extracting cash which reduces those losses. Depending on how far of a pull back you get it sometimes doesn't take very many swings to bring your portfolio into a break even or profit position but mainly it is always better to take the trade because remember that we are not the only swing traders trading off of these levels. Anyone with order flow can see them and trades off of them. The are real, tangible resistance and constitute opportunities to pivot.

MCX possible to reach up to 4500 - To form Cypher / SharkMCX is on the verge to form Cypher / Shark with following targets possible
5400 - 5200 (200 EMA) - 4800 - 4700
In worst case it can go up to 4500 / 4200
Consider 5800 or 20 EMA is resistance / SL.

SOLUSD Weekly Outlook: Bullish Cypher PatternOverview
On the weekly timeframe, BINANCE:SOLUSD has shifted gears since our last analysis. Previously, we flagged a bearish divergence—higher highs in price paired with lower highs on the DMI Delta—hinting at weakening momentum. Price has since declined, and now it’s tapping into a key demand zone, completing what appears to be a Bullish Cypher harmonic pattern.
Why This Matters
Bearish Divergence Played Out : The prior divergence signaled fading bullish pressure, and the subsequent drop brought SOLUSD from its highs into this demand zone—a textbook pullback scenario.
Bullish Cypher Completion : The pattern’s structure is taking shape: X-A (initial up move), A-B (~38.2%-61.8% retracement of X-A), B-C (~113%-141.4% extension of A-B), and now C-D targeting a 78.6% retracement of X-C. The D point aligns with this demand zone, marking a Potential Reversal Zone (PRZ).
Demand Zone Test : This level has historical buying interest. If it holds, it could validate the Cypher and spark a reversal.
Key Considerations
Watch the PRZ : The 78.6% X-C retracement (~D point) is critical. To confirm a bounce, look for reversal signals like a bullish candle, volume surge, or RSI/DMI Delta divergence.
Lingering Divergence Risk : While the drop aligned with the prior bearish signal, momentum remains a question. Cross-check with volume or DMI trends before committing.
Risk Management : For longs, set stops below the demand zone. If shorting a breakdown, target the next support level from prior lows.
Upside Potential : A confirmed Cypher could push the price toward the 38.2% or 61.8% retracement of the C-D leg—map these targets on your chart.
Conclusion
The recent decline in BINANCE:SOLUSD following our bearish divergence call has set the stage for a Bullish Cypher at this demand zone. If buyers defend this level with conviction, the pattern could drive a meaningful reversal, invalidating the prior bearish pressure. However, a failure to hold here might extend the correction. Traders should monitor price action and volume at the PRZ for the next actionable signal.

Zomato short to Medium ready for 300 - 350Zomato has formed a cypher pattern on weekly time frame.
On short to medium, it has potential for following targets.
254 / 266 / 280 / 305 / 330 / 350
242 & 254 is a strong resistance, weekly close above this will have above potential.
Consider 200 to 180 as SL. or It could be considered as buy on dip stock.

Hindalco Short to Medium term target 900Hindalco forming Cypher pattern. It will have a resistance at 665.
Weekly candle close above 665 will have potential upside with following targets
Target1: 665
Target2: 700 & 725
Tagrte3: 775, 830 & 900
At current state SL: 550
At 665, SL: 640

XAGUSD bearish cypher patternOn the daily chart, XAGUSD stabilized and rebounded, and short-term bulls have the upper hand. At present, you can pay attention to the resistance near 33.53 above, and after reaching it, you can pay attention to the potential bearish cypher pattern.

XAGUSD bearish Cypher patternOn the daily chart, XAGUSD stabilized and moved upward, with short-term bulls in the lead. The current upward target can be focused on around 33.53, which is a potential short position for a bearish cypher pattern and is also in the previous supply zone.

Bitcoin Dominance: Elliott Wave and Harmonics Combo (Part 2)MARKETSCOM:BITCOIN Dominance ( #BTC.D / CRYPTOCAP:BTC.D ) indeed started the rise I predicted back in late '22. CRYPTOCAP:BTC rose to the limits, exceeding the 100K Mark.
In #ElliottWave, this is Cycle Wave C (turquoise).
Primary Wave ① (white) completed, with the Corrective Primary Wave ②now in play.
The Correction will pave the way for Alt Season to commence, so the focus will shift to Alt Coins.
#Harmonics are showing #Cypher Patterns, a combo actually, on different degrees.
Bitcoin Dominance ( BTC.D ) Technical Analysis:
* Elliott Wave Impulse: Cycle C (turquoise)
* Harmonic Patterns: Bullish Cyphers
* 88.6% Fibonacci Retracement
* Break-Out with Divergence
* Leading Diagonal in Primary Wave ① (white)
Conclusion:
After a last rise, expecting MARKETSCOM:BITCOIN to top-out and start a Larger Correction.
Alt Season to start and deliver, based on #BTC losing ground.
After this, CRYPTOCAP:BTC to continue ruling, as the one and only #Cryptocurrency.

WelspunLiv - Possible to reach 215 - 250WelspunLiv has shown increase in volume,
MACD levels are rising
With Cypher pattern formation it has next resistance at 180.
Any day candle close above 180 will have next target of 200 / 215.
Above 213 it has potential for 230 / 250

Vesuvius - Forming Cypher / Shark patternVesuvius has formed confirmation for bearish pattern to form Cypher / Shark.
It has potential for below targets;
4400 / 4000 / 3800 for Cypher pattern.
It may also touch 3350 if gives confirmation of shark formation.

DMART Confirmed with Bearish Cypher Pattern DMART has confirmed Bearish Cypher pattern formation, It has potential to reach to below targets;
Target1: 3558
Target2: 3300
3300 is a strong support if broken on Day time frame then possible following targets;
Target3: 3180
Target4: 2900
Stop Loss: 3785 on Day close basis

Nifty is it towards 22800/22300 ? - Read description in detailFollowing my post on August 5 after a dead cat bounce,
Nifty has started to form Cypher or Shark pattern on weekly time frame.
For a Cypher pattern: it will touch 23870/23216/22800
To form a shark pattern fall may extend up to 22300.
It is expected to complete this by December end.

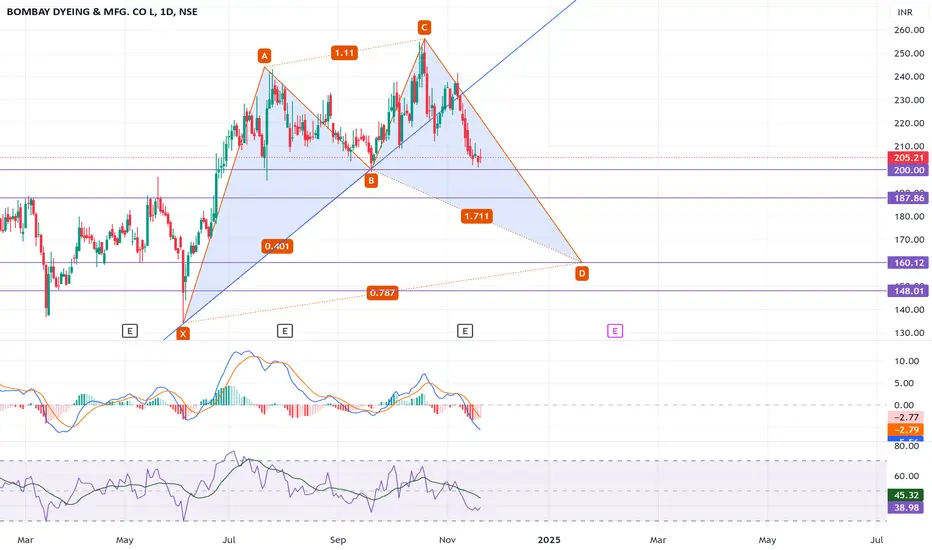
Bombay Dyeing 160/150 possible if broken 200 support on week TFBombay Dyeing has weak MACD and RSI indicator
It is forming Cypher M pattern as it has candles below lakshman rekha line.
Now it has major support at 200, if it close below 200 on weekly time frame then following targets possible.
Target 190/ 170/ 160/150
Ashok Leyland towards 300Ashok Leyland has formed cypher pattern.
Weekly close above 233 will confirm this pattern (at 0.5 Fib level)
Weekly close above will take it to 300 with below targets,
250 / 280 / 300

Cronos (CRO) - Bullish Swing - ResurectionCOINBASE:CROUSD been mostly #Bearish, but things are about to change.
Eventually it found its bottoms.
That's when I loaded #Longs around the 6 and 7 Cents Levels.
Eventually I took profit on the #HODL #Trades at 19 Cents a pop.
* all well documented in the related idea.
What's Next for OKX:CROUSDT ?
As the #BreakOut is now confirmed, a #Bullish Swing is about to start.
That would be the #ElliottWave #Impulse (#MotiveWave).
#AltSeason has started, and MARKETSCOM:BITCOIN is adding fuel.
#AltCoins will most likely get pushed by the #BitcoinDominance ( CRYPTOCAP:BTC.D ) #Retracement.
#TotalMarketCap ( CRYPTOCAP:TOTAL3 & CRYPTOCAP:OTHERS ) are also showing signs of new #ATH coming.
COINBASE:CROUSDC #TechnicalAnalysis
- #ElliottWave A-B-C Sequence
- Primary ⓒ (white) #Impulse
- #Fibonacci Time Zones
- #Fibonacci Retracements Confluence
- #Cypher #Harmonic
My #Long Levels On COINBASE:CROUSD
HODL:
- Entry @ 14 Cents
- TP1 @ 40 Cents
- TP2 @ 60 Cents
#Futures ( CRYPTOCOM:CROUSD.P )
- Moderate Entry @ 14 Cents
- Conservative Entry @ 10 Cents
- TP1 @ 40 Cents
- TP2 @ 60 Cents


HODL on a little longer before buying more.... Just an idea of HODL's current pattern. It appears to be built on shaky foundation...still a bunch of noise about CHIA on the boards however the figures are so wildly entertaining it would be a 1 - mil long shot that Tony scored the deal the way people are talking.
Currently we are bleeding based on BTC cost...how long can the soccer star keep up the appearance before he has to unload some to cover costs? I was a fan...now I'm a skeptic....still holding for an exit but not happy with the current situation.

BITCOIN new ATHs !? BITCOIN new all-time highs ?!
Hello ❤TV community 👋
The new year is still young and the bulls could really take off here ...
Here with a bullish option and a WolveWave(WW) and the targets on the upside.
🖥Intraday chart (12h) and everything important
💡 Everything important in the chart 👀
💥bullish CYPHER Harmonic 👀
👉Volume analysis 👀💪
👉Daily MA50 re-test 👀🔥
🔥BITCOIN roadmap/outlook (from 27th february 2024)
If you like this idea, please leave me a 🚀 and follow for updates 🔥⏰
Furthermore, any criticism is welcome as well as any suggestions etc. - You're also very welcome to share this idea.
Have a nice evening & successful trading decisions 💪
M_a_d_d_e_n ✌
NOTE: The above information represents my idea and is not an investment/trading recommendation! Without any guarantee & exclusion of liability!

Bottom Buy ???Look like it is going for form wedge or cypher pattern ...
Keep Learning or Keep earning
GK trade Manthan

Jio Finance Forming Bearish Cypher - Towards 270Jio Finance has formed Bearish Cypher "W" Pattern
This will take it to following targets
300 / 285 / 270

Classic Cypher PatternTatacomm made made cypher pattern on daily charts wih decent oi.
All indicators (MACD,RSI & ADX) positive.
Risk:Reward = 1:3

DOGE What will happen in the short term ?According to my calculations, the price will reach 0.32 in the short term.
Give me some energy !!
✨We spend hours finding potential opportunities and writing useful ideas, we would be happy if you support us.
Best regards CobraVanguard.💚
_ _ _ _ __ _ _ _ _ _ _ _ _ _ _ _ _ _ _ _ _ _ _ _ _ _ _ _ _ _ _ _
✅Thank you, and for more ideas, hit ❤️Like❤️ and 🌟Follow🌟!
⚠️Things can change...
The markets are always changing and even with all these signals, the market changes tend to be strong and fast!!
