Stellar Lumens XLM a big setupThe SMAs:
After the powerful bull run, the price action of Stellar dropped very hard and broke down the uptrend line support. This trend line was working as a long-term market structure for the price line of XLM. After breaking down this trendline support the price action moved at the weekly 50 simple moving average an at the moment it is moving around this SMA. After the 50 simple moving average, there are also 100 and 200 simple moving averages below the price line.
Support and resistance:
The price action of Stellar has a very strong support zone starting from $0.28 to $0.22. If this support zone will be broken down then the price action can move to $0.12 because there is no significant resistance and support between $0.22 to $0.12. Therefore, for the price reversal, it is very important for XLM to save this supports zone.
Bullish harmonic Cypher move:
On the 2-week time frame chart, the price action of XLM has formed a big bullish Cypher pattern. There is also 25 SMA support in the buying zone. As per the Fibonacci sequence the buying and sell targets of this Cypher pattern can be as:
Buy between: $0.3474 to $0.2248
Sell between: $0.4439 to $0.6757
The maximum extent of potential reversal zone $0.2248 can be used as stop loss. As per the above targets, this trade has a big profit possibility of 200%, and the high loss possibility is 36%, however at this time the risk is low as the price action is already close to the end of the buying zone.
Cypher

MANA toke is ready for a big moveSupport and resistance levels:
From November 2020 to April 2021 the price line of MAN token surged more than 2600%. After finding strong resistance at $1.55 0 the priceline found nice support at $0.50. Right now it is moving between the $0.80 resistance and the $0.50 support level. If the $0.80 resistance will be broken out then we have the next resistance levels at $1 and $1.20. Once candlesticks will break out the $1.20 then MANA can easily move up to break out the next resistance at $1.55.
Daily SMAs and a possible death cross:
On the daily time frame, the price action has recently broken out the 200 and 50 simple moving averages. Now we have the next resistance of 100 simple moving average approximately at the same level where we have the $1 resistance level. The 50 simple moving average was moving down aggressively to form a death cross with 200 SMA. Now it is turning to the right side, therefore, it is possible that now this expected death cross will be avoided. However, if the death cross will be formed then the price action can still move towards the upside. Because the death cross will be formed below the candlesticks and there is a good support of 50 and 200 simple moving averages below the price action.
Bullish harmonic Cypher move:
n the weekly time frame chart, the price action of MANA has formed a big bullish Cypher, at the moment the priceline is moved up after visiting the buying zone, but it is possible that it may give us another chance to catch from the potential reversal zone if BTC takes one more dip. As per the Fibonacci sequence of Cypher, the buying and sell targets can be as below:
Buy between $0.6937 to $0.4283 (There is also strong support at $0.50)
Sell between: $0.9026 to $1. 40
There is also strong support at $0.50, therefore we can also set this level as a stop loss. As per the above targets, this trade has a big profit possibility of 220%, and the loss possibility is 38%, but we can also use $0.50 support as a stop loss to minimize the loss ratio.

MANA formed a big Cypher for upto 200% big moveHi dear friends, hope you are well and welcome to the new update on Decentraland (MANA).
Previously we had a huge trade by MANA token:
Now on the weekly time frame chart, the price action of MANA has formed a big bullish Cypher, at the moment the priceline is moved up after visiting the buying zone, but it is possible that it may give us another chance to catch from the potential reversal zone if BTC takes one more dip.

BTC 1H chart long to 34000as you can see a cypher pattern has formed with double bottom at 1H chart.
a recommendation to buy with stop loss at 32000.
disclaimer: trading is RISKY.

$DARE BULLISH HARMONIC CYPHER PATTERN$DARE BULLISH HARMONIC CYPHER PATTERN, BUILDS TWICE THE SCALE OVER TIME
Volume uptick
Daré Bioscience, Inc., a clinical-stage biopharmaceutical company, focuses on developing and marketing products for women's health in the United States. The company develops therapies in the areas of contraception, fertility, and sexual and vaginal health. Its products in advanced clinical development include DARE-BV1, a bioadhesive hydrogel formulated with clindamycin phosphate 2% to treat bacterial vaginosis in a single administration that has completed Phase 3 clinical trials; Ovaprene, a hormone-free monthly vaginal contraceptive; and Sildenafil Cream, a cream formulation of sildenafil for topical administration to the vulva and vagina for treatment of female sexual arousal disorder. The company's Phase 1-ready products are DARE-HRT1, a combination of bio-identical estradiol and progesterone intravaginal ring for the treatment of vasomotor symptoms in hormone therapy; DARE-VVA1, a vaginally delivered formulation of tamoxifen to treat vulvar vaginal atrophy in patients with hormone-receptor positive breast cancer; and DARE-FRT1, an intravaginal ring containing bio-identical progesterone for the prevention of preterm birth and broader luteal phase support as part of an in vitro fertilization treatment plan. Its products in pre-clinical stage include DARE-LARC1, a combination product designed to provide reversible contraception; ORB-204 and ORB-214, an injectable formulations of etonogestrel to provide contraception over 6-month and 12-month periods; and DARE-RH1, a non-hormonal contraception for men and women. The company is headquartered in San Diego, California.


$CTIB BULLISH CYPHER PATTERN$CTIB BULLISH CYPHER PATTERN
Wyckoff Re-accumulation after decline, Strong Volume building
Yunhong CTI Ltd. develops, produces, distributes, and sells consumer products in the United States and internationally. It offers novelty products, including foil balloons; latex balloons under the Partyloons name; and toy balloon products, which include punch balls, water bombs, and Animal Twisties, as well as other inflatable toy items. The company also offers packaging films and custom film products for food, and other commercial and packaging applications; produces and distributes home organization and container products; assembles and sells Candy Blossom product line; and distribute party goods. It primarily serves various retail outlets, including general merchandise stores, discount and drugstore chains, grocery chains, card and gift shops, and party goods stores, as well as florists and balloon decorators. The company sells its products directly, as well as through a network of distributors and wholesalers, retail chains, and independent sales representatives. The company was formerly known as CTI Industries Corporation and changed its name to Yunhong CTI Ltd. in January 2020. Yunhong CTI Ltd. was founded in 1975 and is headquartered in Lake Barrington, Illinois.


USDCHF, H4 - bearish momentumStrong decline today. Potential Cypher pattern. After some bullish pullback, further decline possible to 78.6 fibo

Despite Bear Market AMP Token SurgedDespite Bitcoin was bearish AMP turned bullish:
The AMP token was following Bitcoin’s move like all other altcoins and cryptocurrencies. But if we take a look at the weekly time frame chart, then after the candle stick which was started on the 17th of May the price action of Bitcoin was moving sideways but on the other hand the AMP token was extremely bullish and surged more than 350%.
Different support and resistance levels:
On the daily time frame chart, the price line of AMP token has different support and resistance levels. Previously $0.062 and $0.075 had been working as a major resistance levels. After rejection, the priceline made turned strong bullish and finally broke out all the resistance levels and found a final resistance at $0.115. Now after being rejected by the $0.115 resistance level the price action has broken down the previous resistances which were now working as supports at $0.075 and $0.062. Now the priceline has finally found strong support at $0.052 and moving above this level.
Broadening formation:
On the weekly time frame chart, it can be easily observed that the price line of AMP token has formed a broadening formation. Every time after getting bounced by the support of this pattern the price action moves up and forms higher than the previous high. This time the price line after being rejected by the resistance, is moving down and there is a distance between the support and the price line AMP token. Therefore, the price action can move a little bit more down for the completion of the bearish move to have another bounce from the support.
Big bullish Cypher pattern:
On the weekly time frame chart, the price action of AMP is forming another bullish Cypher pattern. There is also 25 simple moving average support in the buying zone. Before this, AMP formed a Cypher (which I have already shared on 26th Mar 2021) and this previous pattern produced more than 380% rally.
Previous pattern:
Now this time when AMP token will complete this final leg of the bullish Cypher then it will also complete the move upto the support of the broadening formation.
Current pattern:
Conclusion:
Even though this time the AMP token is again forming a big bullish reversal pattern. However, for the completion of the final leg of this current move we need a little more drop and then the price action will enter the bullish reversal zone. Ideally, after entering the potential reversal zone we can buy this token.

$ONCS BULLISH CYPHER PATTERN$ONCS BULLISH CYPHER PATTERN
Strongest Wyckoff Re-accumulation with uprise, Influx of Strong Volume by MMs, setting up for becoming Parabolic
Consolidation above upper resistance levels
OncoSec Medical Incorporated, a biotechnology company, focuses on developing cytokine-based intratumoral immunotherapies to stimulate the body's immune system to target and attack cancer. The company's lead product candidate is ImmunoPulse IL-12 that uses electroporation device to deliver a DNA-encoded interleukin-12 (IL-12) for reversing the immunosuppressive microenvironment in the treated tumor. It is also developing ImmunoPulse IL-12 with KEYTRUDA in patients with advanced melanoma that is in Phase IIb clinical trials (KEYNOTE-695) and advanced or metastatic triple negative breast cancer (TNBC), which is in Phase II clinical trials (KEYNOTE-890); ImmunoPulse IL-12 and KEYTRUDA in patients with advanced or metastatic melanoma that has completed Phase II clinical trials; and ImmunoPulse IL-12 monotherapy in patients with metastatic melanoma, which has completed the Phase II clinical trials. In addition, the company is developing monotherapy biomarker study in patients with advanced or metastatic TNBC that has completed the Phase II clinical trials; and new DNA-encoded therapeutic candidates and tumor indications to treat deep visceral lesions, such as liver, lung, bladder, pancreatic, and other visceral lesions. It has clinical trial collaborations with Merck & Co., Inc. and its subsidiary in connection with the KEYNOTE-695 and KEYNOTE-890 studies; a research collaboration with Duke University's Center for Applied Therapeutics to evaluate enhanced IL-12 DNA-plasmid; a research collaboration with Roswell Park Comprehensive Cancer Center to evaluate the use of Roswell Park's intravital microscopy and enhanced IL-12 DNA-plasmid; and collaboration with Providence Cancer Institute. The company was formerly known as NetVentory Solutions Inc. and changed its name to OncoSec Medical Incorporated in March 2011. OncoSec Medical Incorporated was founded in 2008 and is headquartered in Pennington, New Jersey.

AMP token forming big Cypher for upto 130% bullish moveHi friends, hope you are well and welcome to the new update on Amp token.
Previously we had a huge trade by AMP token:
Now on the weekly time frame chart, the price action of AMP is forming another bullish Cypher pattern. There is also 25 simple moving average support in the buying zone.

cypher pattern target 1846 as long gold above 1798.5watch out 182x and 184x resistance
nothing change from my previous chart
just add cypher pattern as justification to target 1846


$BLIN BULLISH CYPHER PATTERN$BLIN BULLISH CYPHER PATTERN
Wyckoff Re-accumulation with uprise, consolidation above Resistance levels, strong Volume building
Demonstrates higher highs
Bridgeline Digital, Inc. operates as a digital engagement company in the United States. The company's Bridgeline's Unbound platform enables companies and developers to create websites, web applications, and online stores. It offers Bridgeline Unbound Experience Manager, a marketing automation engine and content management system; Bridgeline Unbound Content Manager that enables non-technical users to create, edit, and publish content via a browser-based interface; and Bridgeline Unbound Commerce, an online B2B and B2C commerce solution that allows users to manage domestic and international commerce initiatives. The company also provides Bridgeline Unbound Marketing, an online marketing management solution that helps marketers drive to their sites through personalized and targeted marketing automation flows; and Bridgeline Unbound Insights to manage, measure, and optimize web properties by recording detailed events and mining data for statistical analysis. In addition, it offers Bridgeline Unbound Social, a social media management solution that empowers customers to set up customized watch lists; and Bridgeline Unbound Franchises, a web content management and e-commerce platform to multi-unit organizations and franchises. Further, the company provides digital strategy, web design and development, usability engineering, information architecture, and search engine optimization services; application monitoring, emergency response, version control, load balancing, managed firewall security, and virus protection services; and shared, dedicated, and Software as a Service hosting services. Further, it offers OrchestraCMS by Bridgeline and Celebros Search by Bridgeline digital solutions. It serves vertical markets, such as financial services, retail brand names, health services and life sciences, technology, credit unions and regional banks, and associations and foundations through its direct sales force. The company was formerly known as Bridgeline Software, Inc. Bridgeline Digital, Inc. was founded in 2000 and is based in Burlington, Massachusetts.

BTC/USD Bullish CypherBitcoin is right now forming a bullish cypher pattern which is a bullish harmonic pattern. If it plays out a perfect entry would be around the $34600 area. Target would be 41-42k. Here are the following reasons why this would be a great entry:
Hidden Bullish divergence on the hourly.
Bullish Cypher with almost perfect retraces.
Perfect retest of the falling wedge that has formed on the daily candle
BTC is currently in phase D of the wyckoff accumulation pattern which according to the pattern should be a big move towards the 41-42k resistance area.
I think these are pretty valid reasons to enter this long position and remember, only enter if price reaches point D which is around $34600 - $34500! Follow for more free trade setups. Good Luck traders!

Dogecoin (Doge) | A Realistic And Huge Move Is About To BeginRejection from the resistance and strong support:
From mid of April to May 2021 the price action of Dogecoin was very strong bullish. Finally, the priceline found very strong resistance at $0.70 and after being rejected by this resistance level the price action of Doge dropped to the support of $0.45. After some struggle, the price action broke down this support and then broke the next supports $0.36 and in $0.26 respectively. Finally, the Doge coin’s price stopped at the strong support at $0.16. At the moment it is trying to break out the next resistance of $0.26, this level was working as support now turned into resistance.
Symmetrical triangle:
If we switch to the small-time period 4-hourly chart, then it can be observed that the trend is being changed from down to up-trend. Now the price action is moving in a symmetrical triangle which is considered as a trend continuation pattern. Now as we are in an uptrend then the priceline may break out the resistance of this pattern for the trend continuation. In this situation, the target as per the symmetrical triangle can be $0.31.
A big bullish Cypher pattern:
On the weekly time frame chart, the price action of Doge has formed a big Cypher pattern. There is also 25 simple moving average support in the buying zone and the 50 SMA below this area. I have already shared this pattern a few days back. At that time the priceline of Dogecoin was moving in the buying zone. Now the candlesticks are moving above the potential reversal zone. It can be noticed that the buying area of the bullish Cypher is very wide. Therefore, we can also use the 25 simple moving average as stop-loss. However, the buying zone goes up to$0.1336. As per the Fibonacci sequence below are the buying and sell targets:
Buy between: $0.2350 to $0.1336
Sell between: $0.3148 to $0.5065
As per the above targets, this trade has a big profit possibility of 279%, and the loss possibility is 43.4%, however, in order to minimize the risk we can use the 25 SMA as stop loss.

GOLD ANALYSIS!!! Hi Everyone, GOLD price reversed 1750.00 USD on 1D chart, level 1.618 of Harmonic XABCD pattern. On daily chart its bullish & can go 1885.00 USD which is weekly resistance & daily support 1750.00 USD if breaks can go 1675.00 USD.
WEEKLY SUPPORT & RESISTANCE.
On weekly chart GOLD price is downtrend, support 1675.00 USD & resistance 2080.00 USD. TVC:GOLD

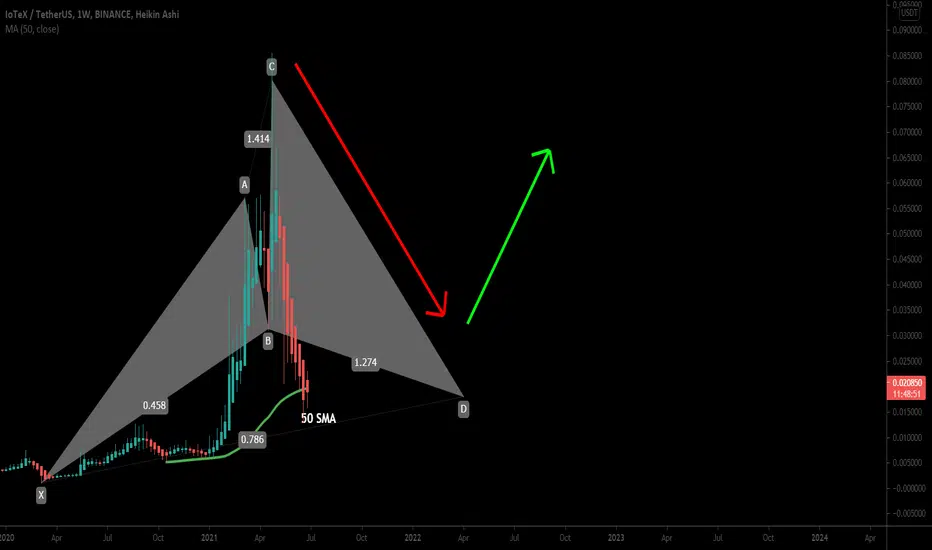
IoTeX (IOTX) coin formed a big cypher for upto 270% profitHi dear friends, hope you are well and welcome to the new update on IoTeX (IOTX) coin.
On the weekly time frame chart, the price action has formed a big Cypher pattern . There is also weekly 50 SMA support in the buying zone.
AUDCHF We can catch a short buy till the 78.6 retracement level(0.69586) or wait for the market to reach 0.69586 to catch a sell

This Will Be A Legendary Move Of Litecoin LTCHi friends hope you are well and welcome to the new update on the Litecoin (LTC).
Down channel:
On the daily timeframe chart, the price action of Litecoin is moving in a down channel since 27 May. Recently the price action has reached the resistance of this down channel and likely to be rejected. I've placed the volume profile indicator on the complete price action moving within this channel which is showing that the price action is already moving in the area where we have very weak interest of the traders. Therefore, the break out is more possible than breakdown. However, after placing that Moon phase indicator it can be also noticed that the dark moon is showing the future price projection to the down side up to $110. But if the price action will be rejected by the resistance of this down channel then a formation of the bullish harmonic move is possible that will not let the priceline of LTC to drop at the support of this channel.
Different support and resistance levels:
After the powerful bullish rally the price action found the resistance at $400 level. Finally the pricline got rejected by this resistance and broke down the $300, $230, $200, $170 and then $140 support levels and finally stopped at the $110 support. Currently it is moving within $110 to $140 support and resistance levels.
Harmonic Cypher pattern:
On the weekly timeframe chart, the price action of Litecoin has completed the formation of bullish harmonic Cypher pattern. There are 25 and 50 simple moving averages in the buying zone as well. The buying and selling targets of this pattern are as below:
Buy between: $144.48 to $91.49
Sell between: $186.18 to $286.33
Conclusion:
Even though the price action of one of the leading crypto currency is not able to breakout resistance of the down channel. However, it is not confirmed yet that the priceline is completely rejected. It is still possible that the price action of LTC will be reversed towards the upside and break out the resistance of the channel and start a big move from here. A big bullish harmonic pattern is also favoring to the breakout from this channel.

You Will Never Regret To Buy Chainlink (LINK) At This SupportHey friends, hope you are well, and welcome to the new update on Chainlink (LINK).
Moved at the support of broadening formation:
The price action of the Chainlink token has formed a big broadening formation on the weekly time frame chart. The formation of this pattern was started in July 2020. If we take a look at the weekly chart, then it can be observed that whenever the price action is getting bounced from the support of this broadening formation it is reaching the resistance and forming the higher than the previous high. This time the price action has already touched the support, therefore, now the price action can start another move towards the upside to make a new high and touch the resistance again.
Rejected by $50 resistance:
On the daily time frame chart, it can be seen that after a long-term powerful bullish rally the price action of Link found a resistance at $50. After being rejected by this resistance the price action has dropped at $15 support level. Now the priceline is moving between the $15 to $20 support and resistance levels for 12 days. If the Bitcoin drops more, then it is possible that the Chainlink will again re-test has the $15 support level. It is a very strong support because previously it has been working as a support and resistance since August 2020.
A big bullilsh Cypher pattern:
While the price action is at the support of a broadening formation on the weekly time frame chart, at the same time the price action of LINK has formed a bullish Cypher pattern. There is also 50 simple moving average support in the buying zone and 100 SMA below the buying area.
The buying and sell targets as per Fibonacci sequence of this Fibonacci based pattern are as below:
Buy between: $23.65 to $16.78
Sell between: $29.04 to $42. 01
The maximum extent of potential reversal zone $16.78 can be used as stop loss. As per the above targets, this trade has a big profit possibility of 150%, and the loss possibility is 30%.
Conclusion:
It is very positive in gesture, that while the price action is at the support of the broadening formation at the same time it has completed the bullish harmonic move. Yes it is possible that if the Bitcoin drops, then priceline of Link can again test the support. However, from the potential of this big Cyhpher, the price can move up and can set a new high.

BTC/USDT Bullish Cypher BTCUSDT at prz of bullush cypher... Daily trendline support below also looks like triangle forming... Targets on chart...
