ETH short - 2nd entry2nd entry on my previous idea on ETH
entry - 1313, still targeting the lows, if it ranges from here i will revaluate for a clean exit
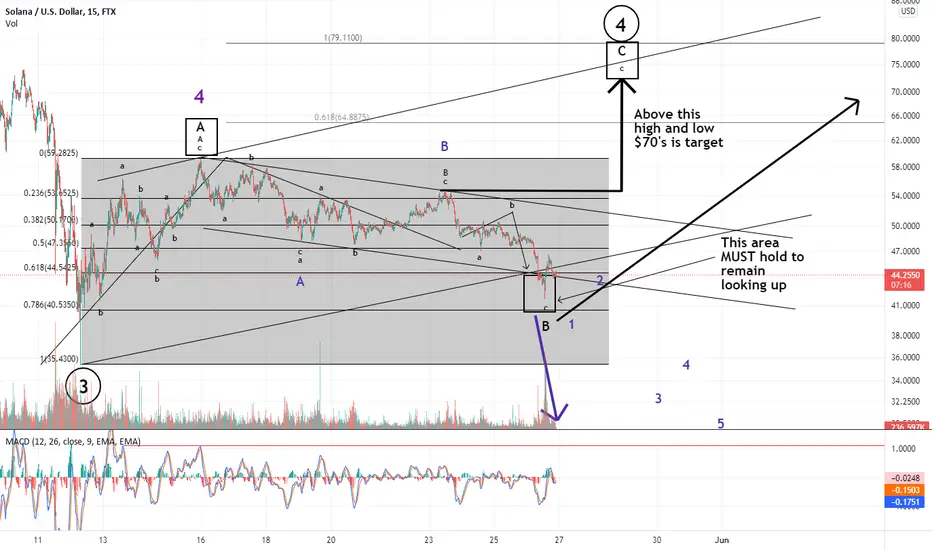
Cyptocurrency

BNX: THE BEST COIN OF THE MOMENT FOR HIGH CYCLE BREAKOUT ATHBNX is still one of the best coins that shows an increase depending on the cycle. before there was some FLEX increase to 170+ since this was a test MTJ it did return to 160 area prices.
Expecting that we can see soon more high targets with stable price action.
As the first test is done: this can mean the second confirmation of 170 can come soon.
The important targets
188/224/332

Cosmos (ATOM) - Short to $4 Just a quick update on one of the alts I've been following this year. I ALMOST accumulated some for a swing trade near the $7-9 levels. Here is the post from June, where I considered doing this.
Back in February, I speculated ATOM could drop all the way to $8, breaking the long term uptrend. Here is the post, when price was still near $30.
Since June, ATOM has rallied better than most altcoins from the lows - going up nearly 100% in value within a couple of months. It would have paid to buy those lows and sell now. But would it really have been that worth it? There are already some signs that the rally is about to fall apart. Although there is still potential for it to head back to the $15-20 levels, I decided to open a short alongside my $1700 ETH short, around $12.70 on Friday. I have a stop near break even in case it wants to push a little higher first. Why am I shorting ATOM, of all coins? Well, although I really dislike Tron (TRX) and would love to keep trying to short it profitably, ATOM's volatility is more fun :)
Let's see if we can get a bearish impulse at least back to the lows, near $5.50, and eventually a new low. This idea will be invalidated in the short term with a break above the $13 level and reclaiming the broken uptrend. Bearish confirmation will be a break below the secondary uptrend, currently holding as support. Zoomed in:
This is not meant as financial advice - it is meant for speculation and entertainment only.
-Victor Cobra

BTC BULLISH BIASBTC/USDT
Day trading, short term traders should be very careful to go long, because of the bearish flag pattern setting up. DOO we are expecting a correction to complete WAVE 5 according to ELLIOT WAVES count. Investors can start buying, but day traders should be careful. Wait to buy at the support or sell at the resistance, because the market is ranging

50 percent bounce seems pretty possibleBTC broke out of the channel and the bounce is pretty much possible to fib 0.5 area. I still think we gonna fall back pretty hard. Keep an eye on the levels. I'm not buying or longing personally.

Technical Analysis Vocabulary!!!BINANCE:CRVUSDTPERP
Hello guys these are some of the trading terms/concepts I apply when trading;
1. BOS : Break of Structure - when price continues to break previous structure and at the same time continues the current trend. A line drawn from recent structure to the current breakout denotes the BOS.
2. CHoCH : Change of Character - when price changes its trend. A line drawn from the last high (for downtrends) or low (for uptrends) of the previous trend all the way to current price action identifies the CHoCH.
3. Liquidity : The buildup of stop orders residing on a trendline of equal highs, lows, trends, or wicks. This is money that can be taken out.
4. Bullish Order Block/Supply Zone : An area of the market where price fell from - highlighting the last bullish candle before the drop in price.
5. Bearish Order Block/Demand Zone : An area of the market where price rose from - highlighting the last bearish candle before the rise in price.
6. Consolidation : An area of the market where prices were oscillating in a corridor - highlighting indecisiveness in the market for that period of time.
- Joel.
Please like and follow to get more ideas/tutorials like this, I'd also love to know what you think about my idea😃.

btcusdt bottom scenariosince market is getting comfortable thinking the last local bottom was IT, chop, chop, chop, take comfortably below the last lows, make everyone freak out, back in the 18-20k range, range for a couple of months then violent move into the 30s resistance.

Which Way ?? of BTCUSD We surely BTC now are downtrend In Timeframe Day but in Timeframe Week still up trend because still upper MA 200 , if we use Dow theory They starting make lower high, Lower low it's may be a Starting of Downtrend in Timeframe week then let see if break down MA200 (or around 25,800) will confirm downtrend in week and the Next level support around 19,500.
#Keep planning

Evening Update: Know Your StopsAs I posted this morning my parameters for the suggested trade I set my stop at $42. It was a small order but nonetheless I was obviously stopped out. If you're in the trade still please know what your risk levels are and establish stops. I have posted many times, I'm not a trader. SO for me to get stopped out and then price run away from me is kind of a running joke.
However I've chosen to include a link to a 3 minute chart. This micro chart shows we have a clear 5 wave impulse up and so far only 3 waves down. So even though I got stopped out this still appears to be a good trade.
If price tonight or tomorrow takes out $47...it may rip to the upside. I say "May" rip....only because this is still a wave 4 so remain vigilant. I'll continue to update on this trade until we breach today's low in which case it's a busted pattern and no one should still be in this set up.
Best to all,
Chris
BTC DOMINANCE PERCENTAGE... BTCSZN or ALTSZN?most of this will depend on BTCUSD, but Im watching to see if BTC.D percentage will break down from here or reverse up... BTC.D breakdown = possible altszn vs. BTC.D reverse up = possible btcszn .. all depending on BTCUSD... we will keep an eye to see what happens and can then better position BTC/Alts/USD accordingly

Is Bitcoin about to loose the critical support level of 30K USD?Is Bitcoin about to loose the critical support level of 30K USD?

GBPAUD H1BUY ENTRY @motti_11_28
STOP LOSS@12.30
TAKE PROFIT@10.26
Market Update (Looking to Long) Like and Subscribe
Thank you Please support our analysis with a like or comment!

Terra (LUNA) Trendline Break and Bearish Retest Funding has been so negative for LUNA recently. It's probably because leveraged traders see most alts going down and figure shorting is free money in this environment. They've learned a harsh lesson. squeezing shorts into oblivion. I entered a scalp short yesterday above $86 and closed near $84. Perhaps it's dangerous to hold a short here (especially with a tight stop), since it can pop off towards $100 one last time. But as you can see on this chart, it's starting to show some hidden weakness. Nothing goes up against Bitcoin forever in this market, and LUNA has been on quite a tear. Not a bad place to book some profits at least into Bitcoin, in my opinion. From what it seems (without knowing too much about the project), it's starting to acquire some of the hype from Solana and Cardano. In this market, when one thing seems like a golden goose, it's often a wise choice to take profit. There will always be another hyped project. And of course, one can always leave some on the table in case it's "the one." 98% of the time this isn't the case.
Zoomed in, you can see there's room for another push into the $90's should the market bounce a bit into the weekly open.
The weekly chart for LUNA/BTC is showing an ugly bearish divergence. We can easily see a failed high here and a longer term top. The daily chart (righthand chart above) shows a bullish channel, with LUNA/BTC testing the middle as we speak.
I may try to short LUNA again if we see the crypto market attempt a false breakout here. For LUNA to look bullish (long term) again, it will need to reclaim that trendline again on the lefthand chart. Regardless of what Bitcoin does, I think it will decline on the ratio.
Let's see what happens! This is meant for speculation and entertainment only - not as financial advice.
-Victor Cobra

I don't like APE's, short opportunity after finishing wave 5APE is most likely going 200+, it sounds stupid i know. I'll show you in a later post why.
But for now here's a short setup coming.
Ps. don't have to short there, ill just be monitoring the breakout and shorting the first rejection near those levels on the 15.

Axie Infinity bullish? Maybe, and this is why.Disclaimer: This is a Newbie analyses with no past Experience! so please Take it Easy
Axie infinity technically looking neutral at the moment. At least, until early/mid May.
The 4hr Candlestick chart suggests the same pattern could be repeated with a fake high in few days maybe, then early/mid May we breakout bullish probably UNLESS the 45 support level is violated prior.
RSI indicator suggesting the same pattern as well.
This is not a financial advise!
Please comment your ideas about the analyses as I am new and want to learn from your experience and knowledge.
Appreciate your constructive comment and feedback in advance.

BTC Dominance BreakoutGet above SMAs and we'll experience same PA as in sep-jan.
Break below, well we have never seen a cryptomarket which has less than 30% dom. of BTC
It would be fun tho

Can we break the yearly VWAP?seems like we are going to break squeeze out this down trend from the yearly lows

A OR BIMO
Both two points AOand B have potentially and should be clearly zoomed all the time
what we need is a clear confirmation and a good risk management
NOTE.Anything can happen
"in my opinion"
BTCUSD

Bitcoin AnalysisBitcoin price action appears to have entered a channel pattern. This pattern often occurs at end of a trend. If this is the case, we could be coming to the end of the sell off of bitcoin and consequently the entire crypto market as a whole since bitcoin is the lead dog in the market and often depicts the direction the market will take. A good time to invest in any altcoin will be when bitcoin breaks out of this channel. If bitcoin breaks below the channel and we see a close below 28k, then this will confirm the continuation of the bear season.

DOGECOIN UPDATEDOGEUSDT multi timeframe update - waiting for potential shorting entries AFTER liquidity above the highs is removed, only if our entry rules are satisfied on lower TF's.

Crypto Outlook for 2022 and 2023Posting so I can look back at my analysis. This is my outlook for 2022 and 2023. I believe we will see a BTC peak late 2022 or early/mid 2023, then alt coins will rally shortly after. I speculate the BTC/USD evaluation could reach $180K.
Some uncertainty around the current global state and foreign affairs.

BITCOIN CYCLES 2022-2023Lets watch for some volatility in April and November of this year with progression upwards into 2023. Yes some crashes too - along the way.
For a portion of this analysis I used a retrograde planetary indicator by @NasserHumood .

BTC Found Support?A lot is going on in the crypto space. More countries are banning BTC, Inflation, and the Feds playing a role like always... Is this the end of the sell-off? We can see that BTC is at a very important support zone. After reaching this zone price quickly was bought up with a quick 5% pump. In my none financial opinion, this would be a great area too long with a tight stop. (:
Don't trade with what you're not willing to lose. Safe Trading, Calculate Your Risk/Reward & Collect!
Love it or hate it, hit that thumbs up and share your thoughts below!
This is not financial advice. This is for educational purposes only.
