BTC,WAIT TO BUY THE BOTTOM.JUST DID SOME HOMEWORK.
WE SHOULD WAIT A LITTLE LONGER,WHEN BTC HITS 8500-9000,BUY BUY BUY!
Cyptocurrency


Bitcoin Analysis in short time frameBitcoin move isnt looking good at this point where there is no volume and the formation of a scary pattern is under way in short time frame. Staying above 11k is good. But breaking the green zone completes the formation of Head and shoulders which is bad. Bitcoin has 100 MA support and also the trend line support at present. But with no volume everything gets f***ed up. If we break the green zone 10,400 might be the next stop but according to H and S the next stop will be at 10,100-10,200. So lets hope that it bounces from here and stays above 11k where it also has cloud support.
What bitcoin has been doing previously is that keep breaking the trend lines and bouncing a little by gaining support from the next trend line but in this case the next trend line is a bit low at 10,400.
Note: This is just my analysis and not a financial advice.


correction ended ?if the correction is done ready to go up we might as well look for extended correction of BTCUSD .right now I think we are ready for another impulsive wave to the upside. even the RIPPLE is on the buy area for long run. invest with proper risk

Simple Says it AllThis is simple chart with Parabolic Stop and Reverse (PSAR) and Momentum Average Convergence Divergence (MACD)
FIBs are used on both. Resistance is FIB .5 for the candles.
FIBs are set at the ultimate lows and highs for each.
Interesting that the MACD signal line (Blue) is just at the MACD zero line.
This is a strong Bear Market still. Trade dips carefully. For those that dare. I trade dips if and only if I can establish a .10 gain on the trade with volume.
It is very possible that a downward continuation will persist until a 786 is achieved.
However, there are recent events that will impact the trades.
1) South Korean officials have halted the embargo on crypto overnight. The legitimate holders of cryptos will be able to continue trading. The exchanges are now fully operational and free to trade.
2) The real BTC futures market contracts that are strong shorts will come off on the 26th.
3) The first set expired Friday-This may be why the 18th popped.
A MACD closure to up an a PSAR change are very good indicators to go long.

TRON - Long opportunityPrice is reaching support zone(693-749), in my opinion this is a good opportunity to go long, target to previous high(2047)
However if this support zone fails, looking toward the next support at 436

ITeksignal Alert: TRXBTC Ready to take off
Just wait for the proper entry point, according to the rules: 1 -2 tick above the signal bar
Again, ITeksignal is given a great opportunity for spotting early trend.
See you on the Trade......

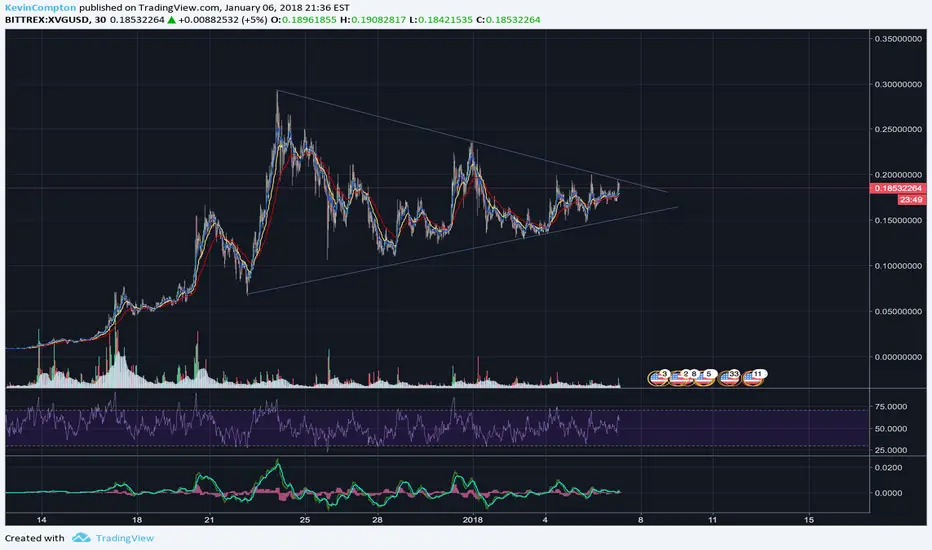
XVG Verge seems to be getting ready to make a move, but staying conservative and neutral till they drop some news on Wraith. With the whole crypto space looking ready to blow up (Anticipating BTC to break 20k) XVG has a good tech and setup but I am staying conservative since there are so much better Crypto plays but this should definitely be on watch!
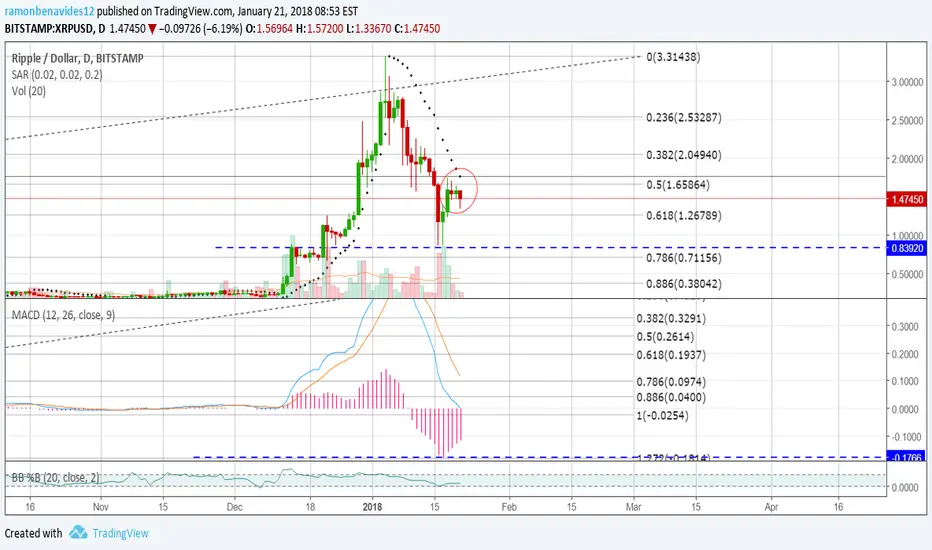
XRP maniaTo buy or not to buy at the all time high? The cryptocurrency world is full of mania, hype and volatility. The latest greatest token gets pumped until dumped. And for the past few years, fortune favors the brave who continue to HODL for the long term.
But just how volatile? We can look at the measure of 30 day historic volatility using an chart study called HV(30) which is currently showing an annualized volatility of 333% on XRP at this time. To better understand how volatile this is, we can compare the S&P 500 volatility which has been measured at record lows of under 10% annualized. To better comprehend an asset this volatile, we can also look at the volatility on a shorter time frame to estimate a typical price range for the next 24 hour period.
Using a formula of :
333% / sqrt(365) = 17.43 we can assume the normal price range of XRP (68% of the time) will be +/-17% over the next 24 hours.
If you're thinking this seems like a very wide range, that's the key point here! The measured price moves are extremely volatile and (in contrast to the bullish speculators pumping up the price of XRP to the next all time high) quite reasonable to expect the price to suddenly drop by 17% overnight (or even 34% when a two standard deviation move happens).
It's essential that speculators understand the risks associated with throwing their cold hard cash into the crypto currency game. Sadly, all too often the euphoric crowd can silence any real serious discussion of uncertainty and risks.. just at the time when it is needed the most.

ETHUSD downtrendETHUSD testing strong resistance to retrace down, possible test at 760 support then continue down trend

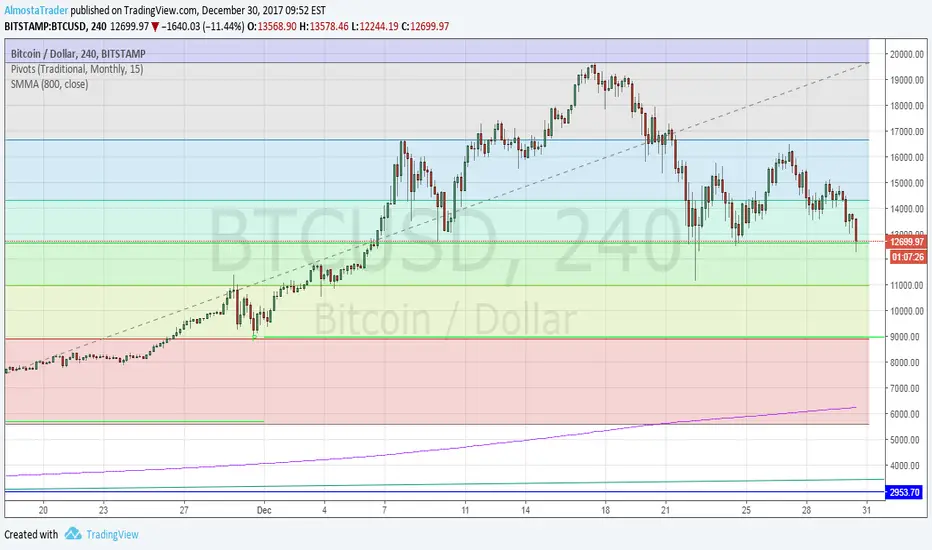
Weekend updateRound numbers look like some support: $11,000 and then $9,000.
Also a monthly pivot going to be offering support at the $9,000 mark.