XAUUSD - Daily | More Consolidation??Gold is back in the upper range of this consolidation zone. You can see the high of the range is 3430, and the low is 3240 roughly.
Bulls:
Gold is pulling back into an Inverted FVG. If the price is bullish, then we should clear the gap with ease. Gold has just eliminated 4 days' worth of choppy bearish price action. Look for gold to give clear signs to enter a buy.
**A new daily candle should appear, creating a new FVG showing buyers are winning
Bears:
So with that said... If Gold fails to remain bullish after Friday's (Aug 1st) 700-pip jump, then the iFVG may have the price react bearishly. Watch for gold to give a clear sign of rejection before entering a sell
**Price may drop to cover Friday's gap. Doesn't mean it's bearish
Cyrpto

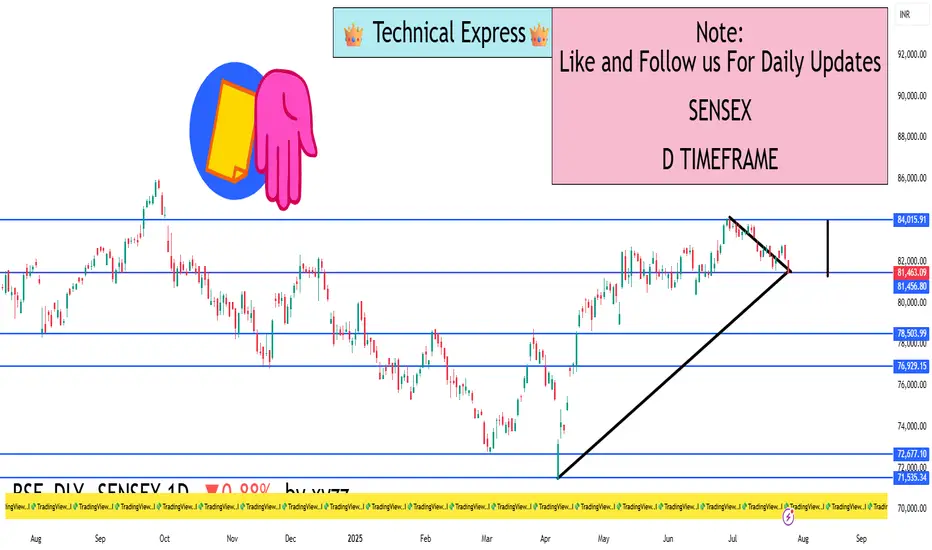
SENSEX 1D Timeframe📉 SENSEX Daily Overview (as of July 25, 2025)
Current Price: Around 81,460
Daily Change: Down by approximately 720 points (–0.9%)
Day’s High: About 82,070
Day’s Low: About 81,400
Previous Close: Around 82,184
📊 1-Day Candlestick Analysis
The candle for today is bearish, indicating strong selling pressure.
The price opened near previous levels but faced resistance at around 82,000.
Sellers dominated most of the day, pushing the index toward the 81,400 support zone.
🔍 Key Support and Resistance Levels
Level Type Price Range
Resistance 82,000 – 82,200
Support 81,400 – 81,000
If Sensex breaks below 81,400, the next target could be around 80,500 or 79,900.
If it holds above support and bounces, it could retest 82,200.
🧠 Technical Trend Analysis
Short-Term Trend: Bearish
Medium-Term Trend: Neutral to mildly bullish (as long as above 80,000)
Market Structure: Lower highs forming, suggesting pressure building on bulls
Indicators (assumed):
RSI may be approaching oversold
MACD likely showing bearish crossover
Volume increasing on red candles—indicating strong sell interest
📌 Sentiment & Market Context
Financial stocks (like banking, NBFCs) are under pressure.
Global cues (such as interest rate uncertainty and geopolitical concerns) are impacting investor confidence.
FII outflows and weak earnings in key sectors are adding to bearish momentum.
The broader trend remains range-bound, but with short-term downside bias.
✅ Strategy Suggestions (For Traders & Investors)
Swing Traders: Wait for a reversal candle (like a bullish engulfing or hammer) before considering long positions.
Breakout Traders: Watch for breakdown below 81,000 for continuation of the fall.
Positional Traders: Can wait to enter near 80,000–79,500 if the market holds that key level.
🔄 Summary
SENSEX is under pressure with a drop of 720+ points.
Technical structure suggests caution, especially if 81,000 breaks.
Support: 81,000 – 80,500
Resistance: 82,000 – 82,200
Locked in – 4H vs 30min Timeframes
When trading high leverage, I need a sharp overview of the market to manage risk and take profits.
Having a parallel view of the 4H and 30min timeframes helps a lot with that.
Right now, on the 30min chart, we’ve had two clean retests of key high timeframe levels :
– the 0.5 Fib
– the weekly 200MA
These retests may justify scaling into a long position , with a stop-loss placed just below the 0.5 Fib or the weekly 200MA.
The structure (MLR > SMA > BB center) supports a long entry, but PSAR hasn’t flipped bullish ye t, so this setup requires caution—especially if price starts closing below these levels. If that happens, it’s better to wait before scaling in .
On the 4H timeframe, selling volume spiked on the last candle , but keep in mind:
→ 3D volume bars have been decreasing , suggesting selling pressure might be weakening overall.
I’ll do my best to keep consistent updates on this parallel timeframe view—it’s proving to be very helpful.
Always take profits and manage risk.
Interaction is welcome.

Raoul Pal's Big Banana. $100 Trillion dollars Crypto market.And how on earth do we reach that point?
Is Raoul's thesis regarding the exponential age accurate, suggesting we have until 2030 to invest and reap the benefits; so "don't F@ck this up!"
As a charting enthusiast, I am eager to see if there exists a technical foundation that could allow us to teleport to those levels and estimate how many years it might take.
Let's examine the entire crypto market, which includes everything from stable coins to tangible real world assets like Gold.
We can distinctly identify three significant consolidation patterns.
Rising wedge #1
a sideways pennant
rising pennant #2
Now, considering this is a logarithmic chart.
It provides us with logarithmic amplitudes and projections.
An amplitude is a calculated move based on the boundaries of the consolidation pattern.
Essentially, it involves taking the top and bottom width and applying it to the breakout point for a rising pattern.
In a #HVF, we utilise the midline of the funnel to forecast targets.
The projections illustrated on this chart pertain to the sideways pennant, employing the flagpole to establish our target.
It is this sideways pennant pole projection that leads us to 100 trillion dollars and beyond. Test it out for yourself if you find it hard to believe these figures could become a reality :)
So there we have it; yes, 100 trillion dollars may appear excessively optimistic and fantastical, especially since we are currently at 3.28 trillion dollars.
However, the charts indicate that Crypto could indeed be the sector where the majority of financial transactions take place in the forthcoming exponential future.

Bitwise Bitcoin ETF | BITB | Long at $46.25It definitely should get everyone's attention when a US Senator (David McCormick) is willing to dish out up to $600,000 in a Bitcoin ETF ( AMEX:BITB ):
Feb. 27: Bought $50,000 to $100,000
Feb. 28: Bought $15,000 to $50,000
March 3: Bought $50,000 to $100,000
March 5: Bought $15,000 to $50,000
March 10: Bought $50,000 to $100,000
March 11: Bought $15,000 to $50,000
March 13: Bought $15,000 to $50,000
March 20: Bought $50,000 to $100,000
Something may be brewing this year with the "U.S. crypto reserve" and I'll throw down a couple grand at $46.25 with a self-proclaimed wild prediction into 2026: Bitcoin to $120,000.
Bitwise ETF Targets:
$50.00
$55.00
$60.00
$65.00

Ethereum 200 Weekly SMAEthereum interestingly is supported fairly well by the 200 Weekly SMA
You could say any good investment if it goes below that type of line is a deal for sure. The farther away it is above the line its more over priced. Things can be a good distance away and still be a good deal but the fact that Ethereum is literally touching it in last two weeks means we need to pay attention. We might not see the same percentage gain as before away from that line later in year 2025 but it was a high raise between 500 to 800 percent above that line in 2021. Which is between 12k and 19k right now.

Ethereum on the Rise, Poised for a Bullish BreakoutBINANCE:ETHUSDT has been showing strong recovery patterns recently, and the technical indicators align with a potential bullish move in the coming months. On the weekly chart, COINBASE:ETHUSD has reached the bottom of an ascending channel, which historically has acted as a strong support zone. This $2K region is not only a psychological barrier but also a key support level that was previously a resistance. As ETH continues to hold above this zone, a rise toward its all-time high (ATH) becomes increasingly probable.
Recent data suggests that 2024 could witness a broader crypto bull run, driven by Ethereum and other major assets. Analysts are optimistic about increased adoption cycles following 2023’s groundwork. Ethereum could benefit from market-wide positive sentiment as key events like Bitcoin’s upcoming halving and ETF inflows are expected to drive demand for cryptocurrencies.
With the technical alignment and favorable market conditions, ETH is well-positioned to see significant growth, potentially targeting levels near EUROTLX:4K as it continues its rise within the ascending channel. This rally could be bolstered by investor confidence in the broader cryptocurrency market as new financial products and solutions drive further participation.

#KOALA AI #KOKO artificial intelligence KOALA AII think it's worth packing a little surprise bag for myself for 2025. Horizontal yellow shaded levels are buy zones. Invalidations are multiple daily closing candles below the horizontal blue box. Targets are the red price tags above. tp: 1.2.3. It is not investment advice, it is everyone's own decision.

ZIL (Zilliqa) Extreme Bullish, Huge move soon🚀 Monster upward move by ZIL!🚀
On Fib Retracement ZIL is halfway until reaching the key level of 23.60% ($0.069) by breaking above the resistance line.
The pattern of the support and the resistance lines suggests that ZIL may make moon moves and test its peak at $0.259!
Key levels to break out during the run:
0.036 0.052 0.067 0.131
There are new updates, bridges, sponsorships and marketing incoming in the next two months!
🚀 🚀 🚀 🚀 🚀 🚀 🚀 🚀 🚀 🚀 🚀

Upcoming Economic Events: A Weekly OverviewUpcoming Economic Events: A Weekly Overview
The coming week promises to be packed with significant economic events and data releases, likely to influence global markets and investor sentiment. Here's a detailed day-by-day preview of the most critical events.
---
**Sunday**
- **Australia**: Judo Bank Manufacturing PMI Final for November.
The week kicks off with insights into Australia's manufacturing sector, potentially setting the tone for global economic trends.
---
**Monday**
- **Japan**: Jibun Bank Manufacturing PMI Final for November.
- **China**: Caixin Manufacturing PMI for November.
- **Eurozone**: HCOB Manufacturing PMI Final for November and Unemployment Rate for October.
- **USA**: ISM Manufacturing PMI and ISM Manufacturing Employment for November.
A day focused on manufacturing data from key global economies. The ISM Manufacturing PMI from the US will be particularly crucial for dollar strength and equity market reactions.
---
**Tuesday**
- **USA**: JOLTs Job Openings for October.
- **Australia**: Judo Bank Services PMI Final for November.
US job openings will be a focal point, providing further insights into the labor market's robustness and potential implications for Fed policy.
---
**Wednesday**
- **Australia**: GDP Growth Rate (QoQ) for Q3.
- **Eurozone**: HCOB Services PMI Final for November.
- **USA**: ADP Employment Change for November, ISM Services PMI, Factory Orders (MoM) for October, and Fed Chair Jerome Powell’s Speech.
One of the week's busiest days. Markets will closely watch US employment and services data, along with Powell's speech, which could offer clues about the Fed's policy direction.
---
**Thursday**
- **Australia**: Balance of Trade for October.
- **Japan**: BOJ Nakamura Speech.
- **Germany**: Factory Orders (MoM) for October.
- **UK**: S&P Global Construction PMI for November.
- **Eurozone**: Retail Sales (MoM) for October.
- **Canada**: Balance of Trade for October, Ivey PMI (s.a) for November.
- **USA**: Balance of Trade for October, Initial Jobless Claims (Nov 30).
A day dominated by trade data and insights into economic activity in major economies.
---
**Friday**
- **Germany**: Industrial Production (MoM) for October.
- **UK**: Halifax House Price Index (YoY) for November.
- **Eurozone**: GDP Growth Rate (3rd estimate) for Q3.
- **Canada**: Unemployment Rate for November.
- **USA**: Non-Farm Payrolls, Unemployment Rate for November, and Preliminary Michigan Consumer Sentiment for December.
The US Non-Farm Payrolls release is a highlight of the week and a key indicator for Fed policy decisions. Combined with unemployment data, it will shape expectations for monetary policy going forward.
---
Summary
The upcoming week is rich in macroeconomic data, spanning sectors from manufacturing to services and labor markets. Key focus areas include US ISM and NFP data, Fed Chair Powell’s speech, and GDP and trade data from major economies. This is a crucial time to stay vigilant in markets and adjust investment strategies based on emerging trends and market reactions.

BTC 1 year outlook. 175k-200k targetWhy would bitcoin 3x plus within a year?
Here is why:
1. Federal funds rate have started to drop as of yesterday. Bitcoin is considered a risk on asset. That means that if interest rates go down, investors sell their low ROI bonds to buy more risky assets to get higher returns, and Bitcoin flourishes in this environment
2. 6 month bull flag. Price is consolidating at all time high before the next big leg up
3. Bitcoin moves in 4 year cycles (until it doesn't) but for now, the peak of the current 4 year cycle should be towards the end of 2025. That is a another year of bullish momentum if history repeats itself thanks to Bitcoin halving cycle
4. We are at the same price as the last peak, yet there are many more large players ready/able to come into the space, including pension funds, ETFs, and governments
5. US government will keep on printing money until the end of time. Currently, both presidential candidates are ignoring the US deficit, and neither are trying to reduce spending to reduce the deficit. The more the US prints money, the more inflation, the more likely investors look for risky assets to store their wealth
6. Who will be selling? Either you believe in BTC or you don't, but people that do believe in BTC are not selling any time soon, while more and more people are starting to buy into the idea

Bitcoin Zip LineI’ve been tracking the course of bitcoin for the last 5 years. I think we are in for some major volatility soon!
Scenario 1:
The bitcoin price will rally as elections are heating up, and more people are sponsoring bitcoin and other meme coins in this period, in addition the tension in the Middle East . Consequently, the US market seems to have some underlying affect on the price of bitcoin. It is connected to the dollar. De-dollarization is a reality. But, you can’t back out on currency yet, too many people would be affected. People presently and people how will. So I expect the fed to cut rates hard, and quickly, without a doubt saving the economic bubble waiting to pop soon. Leading to a red swan event. No I did not say black. Red swan would be a global market chain reaction.
Bitcoin would break upward toward the resistance area $68,387- 69,000which has been building since November 10th, 2020.
If that occurs bitcoin could fall and complete a long striking falling wedge buying opportunity with a target of $42,000 and a liquidity pool around $37,600. Bitcoin could continue with selling pressure, or the big institutions will buy back bitcoin leading to an all time high price in a parabolic move toward $79,000, $100k, 150k, and $200k. Why so high? In short summary banks, coin IPO’s, Mining Harvests, Ripple, and AI
This would be the greatest buy opportunity for either any retail trader or institutional investors. Maybe even private owned firms, government agencies, and owners of any equity.
Scenario 2: A test of the $68’387-$69,000 area and a breakout to $73,000 could lead the price to $79,000. If this price is reached, bitcoin will either decide to test shaky hands and liquidate. As a matter of fact, new hands coming in, can squeeze toward $90,000 above 100k before deciding a true bullish path. Same rules apply on the buy opportunity. This would be parabolic as well which would make $42,000 the main support zone in a long term situation drawback.
This is just a prediction, good luck ;)

Phemex Analysis #20 NEIROETH - A Rollercoaster Coin!NEIROETH, the latest listing on Phemex 3 days ago, but it has exhibited significant price fluctuations since its launch at 29th July 2024.
1. Initial Surge: NEIROETH experienced a remarkable 1990% increase to its all-time high within 11 days.
2. Sharp Correction: However, it subsequently underwent a 91.9% decline to its all-time low in less than 30 days.
3. Rebound: The price has since rebounded by 887%, currently trading at $0.178.
While this volatile price action might seems risky for some investor, yet it's also bring significant gain for those who enter at the right time. Volatility is a Double-edge Sword.
Here we list out a few potential future scenarios on NEIROETH, for us to make informed decision for our trade.
1. Breakout: If the price breaks above the $0.21 level with high volume, it may continue to rise, potentially reaching $0.235, $0.26, or even the all-time high of $0.289.
2. Bearish Drop: Alternatively, if the price falls below the $0.123 support level with high volume, it could continue to decline to $0.07 or $0.057. This might present a buying opportunity, but it's essential to avoid over-allocation.
3. Consolidation: While less likely, NEIROETH's price could consolidate around the $0.21 and $0.12 levels. In this scenario, Phemex Neutral Grid Bots might be a strategy to consider.
Note: Trade Smarter, Not Harder with Phemex. Benefit from cutting-edge features like multiple watchlists, basket orders, and real-time strategy adjustments. Our unique scaled order system and iceberg order functionality give you a competitive edge.
Disclaimer: This is NOT financial or investment advice. Please conduct your own research (DYOR). Phemex is not responsible, directly or indirectly, for any damage or loss incurred or claimed to be caused by or in association with the use of or reliance on any content, goods, or services mentioned in this article.

Bull flag ?Wil we ever see 100k on CME:BTC1! well if this bull flag broke out maybe we will lets see

US30 HEAD AND SHOULER??Simple trading - Head and shoulders
Us30 has broken the neck-line of the Head and shoulder pattern on the 4hr. US30 is bullish on the higher time frames so always be ready for a pullback to the upside. Looking at the daily chart to see if the price will retest previous support and turn resistance.
Due to the lack of bullish momentum on the smaller timeframes, I would NOT advise taking a buy trade to previous support as the market is making lower highs and lower lows. This clearly indicates that the bears are in control. At any moment the price could drop and you do not want to be caught in that.
Be patient and wait for the price to play out. Look to take a sell positions
in the short term at respectable levels

BTCUSD Update - 52k?Seem to be going perfectly as predicted. BTC is dropping, retesting Supports to regain its bullish momentum. For how long will BTC continue to drop?
For start, this is just the beginning. BTC has completed the 4hr M pattern. BTC has just broken under major SUPPORT. This support is also the neckline for the Head and shoulder pattern from the ATH. Waiting for a confirmation by a retest. If BTC rejects the Daily support at 63500, look for sell pressure to 52k.

Was it Charlie the whole time or does Warren just give up...Was it Charlie the whole time or does Warren just give up...
Berkshire Hathaway, Inc. engages in the provision of property and casualty insurance and reinsurance, utilities and energy, freight rail transportation, finance, manufacturing, and retailing services. It operates through following segments: GEICO, Berkshire Hathaway Reinsurance Group, Berkshire Hathaway Primary Group, Burlington Northern Santa Fe, LLC (BNSF), Berkshire Hathaway Energy, McLane Company, Manufacturing, and Service and Retailing. The GEICO segment is involved in underwriting private passenger automobile insurance mainly by direct response methods. The Berkshire Hathaway Reinsurance Group segment consists of underwriting excess-of-loss and quota-share and facultative reinsurance worldwide. The Berkshire Hathaway Primary Group segment consists of underwriting multiple lines of property and casualty insurance policies for primarily commercial accounts. The BNSF segment operates railroad systems in North America. The Berkshire Hathaway Energy segment deals with regulated electric and gas utilities, including power generation and distribution activities, and real estate brokerage activities. The McLane Company segment offers wholesale distribution of groceries and non-food items. The Manufacturing segment includes industrial and end-user products, building products, and apparel. The Service and Retailing segment provides fractional aircraft ownership programs, aviation pilot training, electronic components distribution, and various retailing businesses, including automobile dealerships, and trailer and furniture leasing. The company was founded by Oliver Chace in 1839 and is headquartered in Omaha, NE.

There are fantastic possibilities on the ADA chartI will share a few charts with you today. Since hitting the 0.68 resistance point on the ADA chart, we haven't been able to see a positive turn yet. Nevertheless, a formation has emerged on the ADA chart. This formation is called a 'falling wedge,' which generally indicates a potential upward movement. The target for this formation seems to be in the range of 0.63 to 0.65. However, there is still uncertainty about the upward movement for now; indicators are indecisive, and there are only possibilities.
These possibilities include our first path (Green arrow), which involves rising from here and breaking the formation resistance. The second path (Red arrow) is gathering strength in the range of 0.44 to 0.45 and then moving upward again. Regardless of the chosen path, it is advisable not to make any purchases until the formation is completed, meaning our resistance point is broken. Otherwise, in the event of a general market downturn, the formation we outlined for ADA will be disrupted, and we will need to chart a new course together. So, no rush. Good day and abundant profits, my friends.

BNB/USDT WEEKLY UPDATE BY CRYPTOSANDERS !!Hello friends, welcome to this BNB/USDT update from Crypto Sanders.
Chart Analysis:- Hello friends, what do you think after seeing the chart? Please comment on the BNB WEEKLY update.
BNB struggled to hold its own, which is why it closed the week without any significant changes in its price compared to the previous week.
Buyers managed to keep it above $300 at the time of this post, which is a positive sign. If the overall market sentiment improves in the coming days, BNB may also follow suit.
Looking ahead, this cryptocurrency has been found in a flat trend since the beginning of the year, and a major breakout is needed to take the price to the $360 resistance.
I have tried to bring the best possible results in this chart.
If you like it, hit the like button and share your charts in the comments section.
Thank you.

Will Gold Go To 2000$ Again ?Gold edged higher to start the week as the improving risk mood made it difficult for the USD to find demand in the absence of high-tier data releases. A Bloomberg report claiming that China was considering an equity market rescue package worth about 27 billion USD triggered a rally in global equity indexes.
On Tuesday, Gold failed to build on Monday’s gains, while the benchmark 10-year US Treasury bond yield held steady above 4%. S&P Global PMI data showed on Wednesday that the business activity in the US private sector expanded at an accelerating pace in January. S&P Global Composite PMI improved to 52.3 from 50.9 in December, Services PMI rose to 52.9 and Manufacturing PMI recovered above 50, pointing to an expansion in the manufacturing sector for the first time since April. In turn, the benchmark 10-year US Treasury bond yield edged higher, causing XAU/USD to drop to a weekly low below $2,020.

The danger in the FTMUSDT chart!!!Firstly, what I'm about to convey is not to be considered as investment advice; it's merely a cautionary note. When examined on a 4-hour timeframe, a significant and noticeable Head and Shoulders (H&S) formation is observed in the FTMUSDT chart. The first indicator supporting this formation is volume. Upon examining the volume, you can notice a visible loss of strength. To further confirm this, if you want to be more certain, compare the volume of the candles forming the left shoulder to the volume bars forming the right shoulder. You'll see that the left shoulder's candle volume is stronger, whereas the current right shoulder has lower volume. We also supported this with our second indicator, which is the RSI (Relative Strength Index). There is a noticeable decline in strength in the RSI as well. In summary, while these three signals don't definitively predict a downturn, they indicate that FTM could be significantly impacted in the event of a potential market decline. If you hold it, please exercise caution. Good day and profitable trading.

LIT/USDT probability of bullish move from support?🚀LIT Analysis💎 Paradisers, take note of the potential opportunity with #LITUSDT, which currently shows a heightened probability for a bullish continuation from its support zone.
💎 #LIT has recently experienced a downturn due to market uncertainties. Currently, it seems poised to regain momentum from the support zone at $0.787. If the price sustains its momentum above this level, there's a good chance it will initiate a bullish movement, aiming to overcome the substantial resistance at $1.671.
💎 The ever-evolving cryptocurrency market demands a flexible approach to our trading strategies. If #LIT encounters difficulties in holding its ground at this support zone, a strategic adjustment might be in order.
💎 Under such circumstances, our Plan B would focus on a bullish push from a lower support level, specifically at $0.696. It's imperative to stay alert, as a breach of this level could be an early indicator of a trend shift towards bearish territory. 🌴💰

Bitcoin Headed To The Golden Zone From swing low to swing high, we can see more than 78% retracement happened. Next is swing high to swing low, that's where i marked off the golden zone so 40K is possible again.
Also with the mighty dollar approaching its supply zone and heading into retracement, the market must take advantage of the momentum, as they should.
Patience wins all.
Keep rising.
Always Due Diligence!
