AUDJPY - let's do it again!Hello TradingView Family / Fellow Traders. This is Richard, also known as theSignalyst.
As per our last AUDJPY analysis (attached on the chart), it rejected the first blue circle zone and surged in a parabolic manner.
📈AUDJPY is currently retesting the intersection of the blue trendline and red support.
📚 As per my trading style:
As #AUDJPY is around the latest blue circle zone, I will be looking for bullish reversal setups (like a double bottom pattern, trendline break , and so on...)
📚 Always follow your trading plan regarding entry, risk management, and trade management.
Good luck!
All Strategies Are Good; If Managed Properly!
~Rich
Disclosure: I am part of Trade Nation's Influencer program and receive a monthly fee for using their TradingView charts in my analysis.
Daily Charts

AUDJPY – Trade the Range… Until It EndsHello TradingView Family / Fellow Traders. This is Richard, also known as theSignalyst.
📈AUDJPY has been trading within a big range marked in red.
Moreover, the it is retesting the lower bound of its rising channel marked in blue.
🏹 Thus, the highlighted blue circle is a strong area to look for buy setups as it is the intersection of support and lower blue trendline acting as a non-horizontal support.
📚 As per my trading style:
As #AUDJPY approaches the blue circle zone, I will be looking for bullish reversal setups (like a double bottom pattern, trendline break , and so on...)
📚 Always follow your trading plan regarding entry, risk management, and trade management.
Good luck!
All Strategies Are Good; If Managed Properly!
~Rich
Disclosure: I am part of Trade Nation's Influencer program and receive a monthly fee for using their TradingView charts in my analysis.

110K, maybe 112K at the bestMorning folks,
So, previous setup is done perfect, and BTC even reached 108K area. Now we think that upside potential is limited, at least in short-term. Price is coming to resistance area around 110K and previous top. Some intraday targets point on 112K area as well, but I wouldn't count now on something more extended.
The point is US Dollar stands at record monthly Oversold. So, its weakness in short term is limited as well. Besides, we're coming to very bumpy period of tariffs negotiations from 9th of July, debt ceil discussion and BBB voting, as early as tomorrow...
So for now, uncertainty and risk overcome the upside potential on BTC.

103 to 101K trade and reverse H&S patternMorning folks,
So, our Thu setup is done perfect, both targets are met and even more. Now we consider two different fast trades on BTC.
Now context remains bearish and 103K is rather strong 4H resistance area. So, first trade is scalp "Sell" from ~ 103K with "at least" target of 101K. In fact, choosing of 101K as a minimal target is based on the 2nd trade.
2nd trade is potential reverse H&S is sentiment on the market will start changing. But this is not the fact yet. That's why I place downside arrow here as well, if H&S will not be formed or start failing, BTC could drop lower so, downside trade might be even better.

GBPUSD - Over-Bought!Hello TradingView Family / Fellow Traders. This is Richard, also known as theSignalyst.
📈GBPUSD has been hovering within a big range marked in red and blue.
This week, GBPUSD is retesting the upper bound of the range acting as a resistance.
As long as the resistance holds, we will be looking for shorts on lower timeframes, targeting the lower bound of the range.
📚 Always follow your trading plan regarding entry, risk management, and trade management.
Good luck!
All Strategies Are Good; If Managed Properly!
~Rich
Disclosure: I am part of Trade Nation's Influencer program and receive a monthly fee for using their TradingView charts in my analysis.

EURGBP - Bullish No More!Hello TradingView Family / Fellow Traders. This is Richard, also known as theSignalyst.
📈 EURGBP has been overall bullish trading within the rising channel marked in blue. And it is currently retesting the upper bound of the channel.
Moreover, the orange zone is a strong weekly resistance.
🏹 Thus, the highlighted red circle is a strong area to look for sell setups as it is the intersection of the upper blue trendline and resistance.
📚 As per my trading style:
As #EURGBP is around the red circle zone, I will be looking for bearish reversal setups (like a double top pattern, trendline break , and so on...)
📚 Always follow your trading plan regarding entry, risk management, and trade management.
Good luck!
All Strategies Are Good; If Managed Properly!
~Rich
Disclosure: I am part of Trade Nation's Influencer program and receive a monthly fee for using their TradingView charts in my analysis.

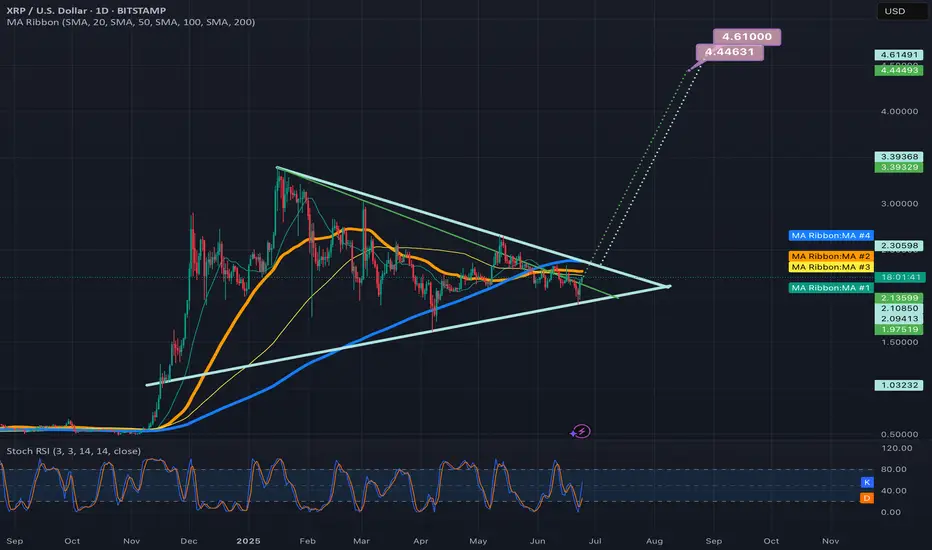
2 potential breakout targets for the symmetrical triangle on xrpDepends on if the green trendline is the more valid top trendline or the light blue one is. *not financial advice*
AUDCHF - Wait For it!Hello TradingView Family / Fellow Traders. This is Richard, also known as theSignalyst.
📈AUDCHF has been overall bearish trading within the flat falling broadening wedge pattern marked in red.
Moreover, the green zone is a supply.
🏹 Thus, the highlighted red circle is a strong area to look for sell setups as it is the intersection of the upper red trendline and supply.
📚 As per my trading style:
As #AUDCHF approaches the red circle zone, I will be looking for bearish reversal setups (like a double top pattern, trendline break , and so on...)
📚 Always follow your trading plan regarding entry, risk management, and trade management.
Good luck!
All Strategies Are Good; If Managed Properly!
~Rich
Disclosure: I am part of Trade Nation's Influencer program and receive a monthly fee for using their TradingView charts in my analysis.

99K and 97.5K potential targetsMorning folks,
As you can see, not occasionally last time we chose only nearest 107K and 109K targets. Market indeed looks a bit heavy. Now short-term context turns bearish and we consider reaching of 99K target as rather high. Next potential target area is 97.K - butterfly target and daily Fib support.
Obviously now we do not consider any new longs and need some clear signs of sentiment changing, that we do not have by far. Let's see what will happen around support area

USDCHF - Now Bullish!Hello TradingView Family / Fellow Traders. This is Richard, also known as theSignalyst.
As per our last USDCHF analysis, attached on the chart, it rejected the upper bound of the orange channel and traded lower.
What's next?
📈USDCHF is now retesting the lower bound of the channel.
Moreover, the blue line is a strong weekly low.
🏹 Thus, the highlighted blue circle is a strong area to look for buy setups as it is the intersection of the lower orange trendline and weekly low.
📚 As per my trading style:
As #USDCHF is around the blue circle zone, I will be looking for bullish reversal setups (like a double bottom pattern, trendline break , and so on...)
📚 Always follow your trading plan regarding entry, risk management, and trade management.
Good luck!
All Strategies Are Good; If Managed Properly!
~Rich
Disclosure: I am part of Trade Nation's Influencer program and receive a monthly fee for using their TradingView charts in my analysis.

107.6-107.8 and 109-110KMorning folks,
So, position taking stage is done, now let's take a look at targets. In general we have a sequence of a few targets, starting from 107.6-107.8, 109-110, 113 and 116K. But in current situation I would watch for only first two.
Daily overbought is around 114, so 116K target seems too far. 113K is possible, but with rather extended downside action last week, it seems as very optimistic. That's why, more or less base case seems around 109-110K, while the easiest target is 107.6-107.8K.
So, once the first target will be reached - think about partial profit booking, if you want to continue trading. Say, take off 30-40% and move stops to the breakeven on the rest.

106.5K and 104.5KMorning folks,
As we've suggested upward action happened. Now overall situation stands relatively easy to understand. 100K seems like short-term vital area for upside tendency. While two support levels of 106.5K and 104.5K are those which market has to hold to keep tendency intact.
I would even prefer 106.5K area because this is also natural support line and because it agrees with downside AB-CD 1.618 extension target.

Nasdaq Potential Daily ReversalIPDA Speaking + Contract closure we can see speed take place to reach BSL outside IPDA range but why whould the just past 20 days HRLR instead of moving higher with speed
Because of Intermarket striction
maybe to build more stops there but it would be greater in terms of liquidity efficiency to place a fake D high in here and reverse, take the liquidity lower on D HRLR and then continue higher to reach 22,672.00.
The key here is: do we breach above the D SIBI or do we react from it.
one of two will unlock the next 20 to 40 trading days of delivery.

NZDJPY - One More Bullish Leg!Hello TradingView Family / Fellow Traders. This is Richard, also known as theSignalyst.
📈NZDJPY has been overall bullish trading within the rising wedge marked in blue.
Moreover, the green zone is a strong support!
🏹 Thus, the highlighted blue circle is a strong area to look for buy setups as it is the intersection of support and lower blue trendline acting as a non-horizontal support.
📚 As per my trading style:
As #NZDJPY approaches the blue circle zone, I will be looking for bullish reversal setups (like a double bottom pattern, trendline break , and so on...)
📚 Always follow your trading plan regarding entry, risk management, and trade management.
Good luck!
All Strategies Are Good; If Managed Properly!
~Rich
Disclosure: I am part of Trade Nation's Influencer program and receive a monthly fee for using their TradingView charts in my analysis.

BTC 1H Reverse H&S Morning folks,
So, drop is done due to Trump-Musk conflict, although we haven't called to trade it. Anyway, current picture is much better and doesn't need a lot of comments. We have reverse H&S in progress, with potential area for entry around 102.5-103K where we expect the right arm should appear. Invalidation point is ~100K (bottom of the head).

Weak bearish contextMorning folks,
Not many changes since our last discussion. Yes BTC moved slightly lower, as we suggested, but you can see by yourself - action is very slow and lazy. Usually when bears control the market, action has to be stronger.
It means that overall context remains bearish but it is weak and not very attractive for trading, although it is not forbidden of course. We consider upside breakout of 107-108K area as a vital moment for this context. While downside target is around 97-98K.

NZDCAD - Lucrative Range!Hello TradingView Family / Fellow Traders. This is Richard, also known as theSignalyst.
📈NZDCAD has been hovering within a range between the red support and blue resistance.
This week, NZDCAD has been bearish and approaching the red support.
Moreover, it is retesting the lower bound of its rising wedge pattern in blue.
🏹 Thus, the highlighted blue circle is a strong area to look for buy setups as it is the intersection of support and lower blue trendline acting as a non-horizontal support.
📚 As per my trading style:
As #NZDCAD approaches the blue circle zone, I will be looking for bullish reversal setups (like a double bottom pattern, trendline break , and so on...)
📚 Always follow your trading plan regarding entry, risk management, and trade management.
Good luck!
All Strategies Are Good; If Managed Properly!
~Rich
Disclosure: I am part of Trade Nation's Influencer program and receive a monthly fee for using their TradingView charts in my analysis.

98-101KMorning folks,
Last time BTC was not able to provide the direction as it was standing in triangle and we prepared "neutral" update, waiting for triangle breakout.
Now we see that this has happened to the downside and market just stands slightly above XOP target. So we consider 98-101K area as the nearest target.
Second, once (and if) this action will be over - take look at H&S, and it could trigger stronger downside retracement. This it turn might be quite welcome for weekly reverse H&S pattern .
That's being said, the first step that we're watching - is down to the potential neckline around 98-101K. Then we decided for to do next.

Minor advantage on the bullish sideMorning folks,
So, downside AB-CD action is started as we suggested. But, it is very slow and going heavy. Appearing of triangle shape here and early signs of bullish dynamic pressure on daily chart turns the balance slightly on the bullish side.
Still, we do not have yet any clear patterns that makes us sure. So, if you're conservative - it would be better to wait a bit. If you still want to buy inside the triangle - it would be better to place initial stop below OP target, just not to be washed out occasionally, if AB=CD will be completed. Because it doesn't break the bullish context but could give us "222' Buy instead.

Intraday scenariosMorning folks,
Now we do not see yet any background for a "big game". Market needs time to manifest the next step. We said previously that it might be either direct upside action or big reverse H&S on weekly chart.
Now it is too few time passed to understand this. On a daily chart we have bearish context and engulfing pattern. So all that we have for Mon-Tue is an intraday downside AB=CD setup with ~104 and 101K targets.

ETH - BBB - Bullish Building Block!Hello TradingView Family / Fellow Traders. This is Richard, also known as theSignalyst.
🏢 ETH Building Blocks:
📈 Short-Term Bullish:
ETH is currently bullish trading within the second floor in the shape of a rising channel marked in green.
As ETH retests the lower green trendline and $2,550 structure, we’ll be looking for short-term trend-following long setups!
📈 Long-Term Bullish:
For the bulls to remain in control medium-term and push towards the $3,000 mark, a break above the last major high at $2,750 is needed.
📉 Short-Term Bearish:
If the $2,550 structure is broken downward, ETH's momentum will be shifted from bullish to bearish leading to a correction phase towards the $2,300 support.
📚 Always follow your trading plan regarding entry, risk management, and trade management.
Good luck!
All Strategies Are Good; If Managed Properly!
~Rich

118.75KMorning folks,
So, last time BTC was not able to show retracement that we've suggested. In fact by the end of the session, no reversal day was formed. It was some fake alarm. Our long-term 110K target has been completed, so monthly grabber has reached the minimum target.
But for now we see nothing to do. We consider no shorts. Market stands confidently around the top, without sharp drop back, it is not at overbought or at some strong resistance, so it could keep going higher. Next our upside target is 118.75K. So we could keep existed longs, just don't forget to manage stops.
If downside pullback still starts it might become good chance for long entry again. Market now is driven by rebalancing portfolios of big funds that have to sell US assets as they lost AAA rating. This explains why dollar is falling while yields are raising. This is not fast process and probably will last for some time more.

+60% gain overnight with Buy & Hold overnight $4 to $6.50 $EDBLEASY 💰 +60% profit overnight with BUY & HOLD Alert sent at market close yesterday $4.00 🚀 this morning it's up at $6.50+
🤑 NASDAQ:EDBL
The technical analysis was simply too good to miss out on, the pop was either going to happen after hours, premarket or right after market open today so it only made sense to get in for after hours to be sure!
