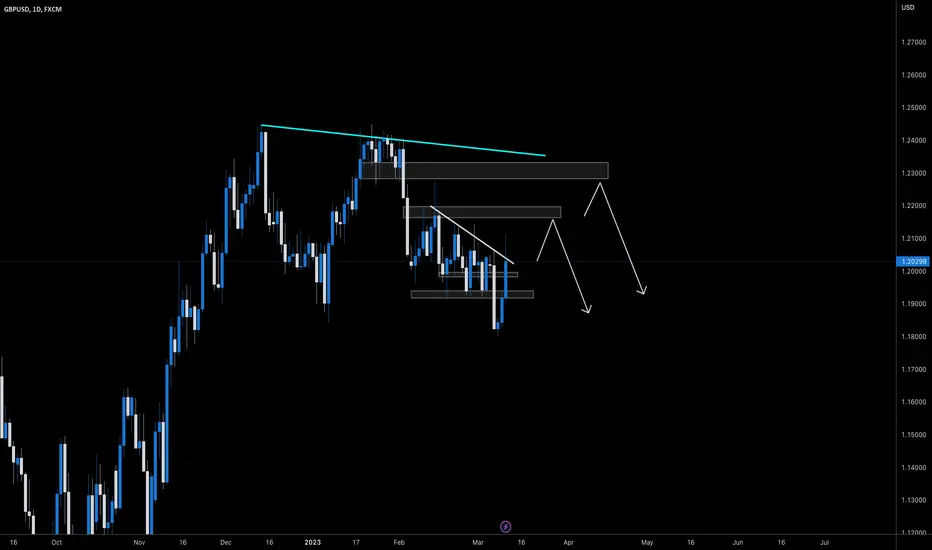
GBPUSD I Short and long opportunity outlookWelcome back! Let me know your thoughts in the comments!
** GBPUSD Analysis - Listen to video!
We recommend that you keep this pair on your watchlist and enter when the entry criteria of your strategy is met.
Please support this idea with a LIKE and COMMENT if you find it useful and Click "Follow" on our profile if you'd like these trade ideas delivered straight to your email in the future.
Thanks for your continued support!
Daily Charts


EURUSD D1 AnalysisEUR/USD Forecast
Can break 1.07 support level?
If not, we expect declining to 1.03

CADCHF Update I Potential bounce from pandemic lowWelcome back! Let me know your thoughts in the comments!
** CADCHF Analysis - Listen to video!
We recommend that you keep this pair on your watchlist and enter when the entry criteria of your strategy is met.
Please support this idea with a LIKE and COMMENT if you find it useful and Click "Follow" on our profile if you'd like these trade ideas delivered straight to your email in the future.
Thanks for your continued support!

Pause @ 19.20-19.50Morning folks,
So, everything goes with the plan - market was not even needed to form H&S pattern on intraday charts, that we've previously considered. As crypto-industry has got the 2nd hit after FTX from SilverGate bank, BTC just collapsed, significantly lower than our intraday target of 21K. Now we have to increase the time frame and watch on daily chart directly.
Here we see nearest target of 19.2-19.5K, that could provide short-term support and even become a reason for the bounce up to 21-21.5K area (if NFP will be not too strong). But, according to our fundamental view, we do not see reason for major trend reversal on BTC market. BTC performance around 17.5-19K area is vital for next action. Either it will be to 32K or down to our major monthly target of 12.23K. Let's see...

Daily BTC 4HChart - resistance and supportHello everyone, let's look at the BTC to USDT chart on a 4-hour time frame. As you can see, the price is moving in the lower part of the downtrend channel.
Let's start with the support line and as you can see the first support in the near future is $21954, if the support is broken then the next support is $21833 and $21738 .
Now let's move on to the resistance line, as you can see the first resistance is $22014, if you manage to break it the next resistance will be $22115 and $22198.
Looking at the CHOP indicator, we see that we still have the energy to move, the MACD indicates entering a local downtrend, while the RSI is moving at the lower end of the range, which can potentially give a change in the trend.

21.4-21.8Morning folks,
So, everything goes with the plan, that's why just two words - watching for neckline hit around 21.4-21.8K. Bears should tight stop and think about booking, while bulls have nothing to do by far, should wait when neckline will be reached, then watch for reaction and potential bullish patterns on 1H chart.

USDCHF I It will head upward Welcome back! Let me know your thoughts in the comments!
**USDCHF Analysis - Listen to video!
We recommend that you keep this pair on your watchlist and enter when the entry criteria of your strategy is met.
Please support this idea with a LIKE and COMMENT if you find it useful and Click "Follow" on our profile if you'd like these trade ideas delivered straight to your email in the future.
Thanks for your continued support!

easyMarkets ASX 200 Daily - Quick Technical OverviewLooking at the technical picture of the Australian index ASX 200, we can see that from around the beginning of February, the index has been trading inside a falling wedge pattern, which could be classed as a bullish indication, especially if the upper side of that pattern gets violated. Today we saw that violation and the index made a strong move to the upside. In addition to all that, the price remains above a medium-term tentative upside support line taken from the low of October 3rd. Although the near-term outlook seems to be more positive then negative, we would still prefer to wait for another push above the 7260 barrier and the 50-day EMA, just to get a bit more comfortable with higher areas.
Alternatively, to shift our view towards lower areas, a break of the aforementioned upside line and a drop below the 7110 territory would be required. Such a move would not only break the current medium-term trend but also would confirm a forthcoming lower low. That's when we would get comfortable with examining lower levels.
Disclaimer:
easyMarkets Account on TradingView allows you to combine easyMarkets industry leading conditions, regulated trading and tight fixed spreads with TradingView's powerful social network for traders, advanced charting and analytics. Access no slippage on limit orders, tight fixed spreads, negative balance protection, no hidden fees or commission, and seamless integration.
Any opinions, news, research, analyses, prices, other information, or links to third-party sites contained on this website are provided on an "as-is" basis, are intended only to be informative, is not an advice nor a recommendation, nor research, or a record of our trading prices, or an offer of, or solicitation for a transaction in any financial instrument and thus should not be treated as such. The information provided does not involve any specific investment objectives, financial situation and needs of any specific person who may receive it. Please be aware, that past performance is not a reliable indicator of future performance and/or results. Past Performance or Forward-looking scenarios based upon the reasonable beliefs of the third-party provider are not a guarantee of future performance. Actual results may differ materially from those anticipated in forward-looking or past performance statements. easyMarkets makes no representation or warranty and assumes no liability as to the accuracy or completeness of the information provided, nor any loss arising from any investment based on a recommendation, forecast or any information supplied by any third-party.

eurgbpok first of all this is a re-drawn chart from earlier today! instead of a phone (terrible) i used my PC! and look! so, here goes! my chart is self explained I personally go by my own Analysis and judgement on what I see!
first of all the purple lines drawn are S/R on the daily chart! giving me a nice uptrend. second I then use my daily chart for the floor and ceiling. third I drop down to the 4HR to give me a deeper insight on what is happening within my daily chart! 4th I spot a trend happening heading short, which then I created a channel within inside! since the daily has rejected the third time on our trendline, perhaps now we can see it moving back down to the support area!
thank you for reading and good luck everyone on the trading journey!
please provide feedback so I can be a better trader! thank you!

Same target - 21.5KMorning folks,
BTC was able to complete upside XOP retracement target, but overall action is choppy and slow, which suggests retracement nature. That's why we keep the same trading plan and consider short position with target around 21.5K area. Sudden upside breakout of 24.25K resistance means that BTC goes to 26K target and is forming upside 3-Drive "Sell" instead of H&S that we 're watching now.
It doesn't change our mid term view of downside reversal in general but changes the price shape and the pattern that will be put on background of this reversal.

easyMarkets EURGBP Daily - Quick Technical OverviewEURGBP found resistance near a short-term downside line. In order to consider a further move north, a push above that line would be required.
Please watch the video for the analysis.
Disclaimer:
easyMarkets Account on TradingView allows you to combine easyMarkets industry leading conditions, regulated trading and tight fixed spreads with TradingView's powerful social network for traders, advanced charting and analytics. Access no slippage on limit orders, tight fixed spreads, negative balance protection, no hidden fees or commission, and seamless integration.
Any opinions, news, research, analyses, prices, other information, or links to third-party sites contained on this website are provided on an "as-is" basis, are intended only to be informative, is not an advice nor a recommendation, nor research, or a record of our trading prices, or an offer of, or solicitation for a transaction in any financial instrument and thus should not be treated as such. The information provided does not involve any specific investment objectives, financial situation and needs of any specific person who may receive it. Please be aware, that past performance is not a reliable indicator of future performance and/or results. Past Performance or Forward-looking scenarios based upon the reasonable beliefs of the third-party provider are not a guarantee of future performance. Actual results may differ materially from those anticipated in forward-looking or past performance statements. easyMarkets makes no representation or warranty and assumes no liability as to the accuracy or completeness of the information provided, nor any loss arising from any investment based on a recommendation, forecast or any information supplied by any third-party.

BTC LOOKING SCARY!Btc looking scary , as it is forming a rising wedge at 1 day time frame if it get breaks than it may dump the price to next key support of 21800$ and if it gets also break than upto 200 ma support which covers the range of approx 19500$-19150$ . Manage your long and spot trades with proper sl because daily ta is still bearish and macros are also not supporting the market yet.

easyMarkets EURUSD Daily - Quick Technical OverviewEURUSD got a good boost yesterday, traveling back to its 50-day EMA, where it found resistance. If we clear that area, more buyers might join in.
For today, watch out for the ECB's Account of Monetary Policy Meeting, together with the EU preliminary CPI numbers.
Please watch the short video for the remaining analysis.
Disclaimer:
easyMarkets Account on TradingView allows you to combine easyMarkets industry leading conditions, regulated trading and tight fixed spreads with TradingView's powerful social network for traders, advanced charting and analytics. Access no slippage on limit orders, tight fixed spreads, negative balance protection, no hidden fees or commission, and seamless integration.
Any opinions, news, research, analyses, prices, other information, or links to third-party sites contained on this website are provided on an "as-is" basis, are intended only to be informative, is not an advice nor a recommendation, nor research, or a record of our trading prices, or an offer of, or solicitation for a transaction in any financial instrument and thus should not be treated as such. The information provided does not involve any specific investment objectives, financial situation and needs of any specific person who may receive it. Please be aware, that past performance is not a reliable indicator of future performance and/or results. Past Performance or Forward-looking scenarios based upon the reasonable beliefs of the third-party provider are not a guarantee of future performance. Actual results may differ materially from those anticipated in forward-looking or past performance statements. easyMarkets makes no representation or warranty and assumes no liability as to the accuracy or completeness of the information provided, nor any loss arising from any investment based on a recommendation, forecast or any information supplied by any third-party.

Bitcoin on the daily continued...As Bitcoin rejects off the key area it's following the prediction path line accurately so far over 2 weeks after the initial idea was published.
The 4H 200EMA has provided support once again and on the 1D 30EMA support has held. Due to this BTC still has a good chance of progressing in the bullish trend if this structure holds.
However, the overall trend switches from bullish to bearish after price falls below the 1D 200EMA & the red dotted trendline.
Personally I think the chop will continue going into the weekend without any crazy news effecting the market.

easyMarkets Dow Jones Daily - Quick Technical OverviewAfter a recent decline, the DJIA index found support near the 32700 area, which is near the lowest point of December. If, eventually, that support area surrenders, this could clear the path towards the 31740 zone.
Alternatively, a break above a short-term tentative downside resistance line, drawn from the high of February 14th, could help attract the bulls back into the game. More of them may join on a move above the 200-day EMA.
Disclaimer:
easyMarkets Account on TradingView allows you to combine easyMarkets industry leading conditions, regulated trading and tight fixed spreads with TradingView's powerful social network for traders, advanced charting and analytics. Access no slippage on limit orders, tight fixed spreads, negative balance protection, no hidden fees or commission, and seamless integration.
Any opinions, news, research, analyses, prices, other information, or links to third-party sites contained on this website are provided on an "as-is" basis, are intended only to be informative, is not an advice nor a recommendation, nor research, or a record of our trading prices, or an offer of, or solicitation for a transaction in any financial instrument and thus should not be treated as such. The information provided does not involve any specific investment objectives, financial situation and needs of any specific person who may receive it. Please be aware, that past performance is not a reliable indicator of future performance and/or results. Past Performance or Forward-looking scenarios based upon the reasonable beliefs of the third-party provider are not a guarantee of future performance. Actual results may differ materially from those anticipated in forward-looking or past performance statements. easyMarkets makes no representation or warranty and assumes no liability as to the accuracy or completeness of the information provided, nor any loss arising from any investment based on a recommendation, forecast or any information supplied by any third-party.

easyMarkets Brent Oil Daily - Quick Technical OverviewBrent oil continues to trade between two trendlines, a short-term upside one taken from the low of December 9th and a downside line drawn from the high of July 28th. As long as the commodity remains between those two lines, we will stay neutral.
If the downside line gets violated, we will start examining higher areas as potential targets, however, more buyers may join in if Brent oil jumps above the 89-dollar mark. Additionally, the commodity could also rise above the 200-day EMA, which also could be seen as a bullish indication.
Alternatively, a break below the aforementioned upside line and an additional move below the 80.43 zone may attract more sellers into the game, possibly clearing the way to the 75.00 area.
Disclaimer:
easyMarkets Account on TradingView allows you to combine easyMarkets industry leading conditions, regulated trading and tight fixed spreads with TradingView's powerful social network for traders, advanced charting and analytics. Access no slippage on limit orders, tight fixed spreads, negative balance protection, no hidden fees or commission, and seamless integration.
Any opinions, news, research, analyses, prices, other information, or links to third-party sites contained on this website are provided on an "as-is" basis, are intended only to be informative, is not an advice nor a recommendation, nor research, or a record of our trading prices, or an offer of, or solicitation for a transaction in any financial instrument and thus should not be treated as such. The information provided does not involve any specific investment objectives, financial situation and needs of any specific person who may receive it. Please be aware, that past performance is not a reliable indicator of future performance and/or results. Past Performance or Forward-looking scenarios based upon the reasonable beliefs of the third-party provider are not a guarantee of future performance. Actual results may differ materially from those anticipated in forward-looking or past performance statements. easyMarkets makes no representation or warranty and assumes no liability as to the accuracy or completeness of the information provided, nor any loss arising from any investment based on a recommendation, forecast or any information supplied by any third-party.

easyMarkets DAX Daily - Quick Technical OverviewThe technical picture of DAX on our daily chart shows that the index is currently stuck between two trendlines - a short-term downside resistance one taken from the high of February 9th and medium-term upside support line drawn from the low of October 3rd. Given that DAX has been on a roller coaster ride for the whole month of February, we need to see a clear violation of one of the trendlines in order to consider a near-term directional move, either up or down.
However, we would get more comfortable with higher areas if we also see a break somewhere above the 15700 zone.
For the downside, a drop below the 15200 territory might attract more sellers into the game.
Disclaimer:
easyMarkets Account on TradingView allows you to combine easyMarkets industry leading conditions, regulated trading and tight fixed spreads with TradingView's powerful social network for traders, advanced charting and analytics. Access no slippage on limit orders, tight fixed spreads, negative balance protection, no hidden fees or commission, and seamless integration.
Any opinions, news, research, analyses, prices, other information, or links to third-party sites contained on this website are provided on an "as-is" basis, are intended only to be informative, is not an advice nor a recommendation, nor research, or a record of our trading prices, or an offer of, or solicitation for a transaction in any financial instrument and thus should not be treated as such. The information provided does not involve any specific investment objectives, financial situation and needs of any specific person who may receive it. Please be aware, that past performance is not a reliable indicator of future performance and/or results. Past Performance or Forward-looking scenarios based upon the reasonable beliefs of the third-party provider are not a guarantee of future performance. Actual results may differ materially from those anticipated in forward-looking or past performance statements. easyMarkets makes no representation or warranty and assumes no liability as to the accuracy or completeness of the information provided, nor any loss arising from any investment based on a recommendation, forecast or any information supplied by any third-party.

Watching for 22K areaMorning folks,
We're keep going with our H&S pattern. Since market was not able to form upside butterfly pattern, our H&S turns to 1.27 ratio instead of common 1.618. Now we're watching price action back to the neckline around 22K.
There are few moments to watch. Price now stands at strong resistance area around 23.5K area. Normally it is enough to keep bearish market moving down. If, somehow, BTC will keep upside action, H&S might not be formed. And we could get upside 3-Drive "Sell" instead with 26.3K top.
Second is, we have few trading setups. Now intraday traders could consider short entry with 22K target. Once neckline will be reached - another chance for scalp long entry could be formed. If you trade on higher time frames - it is nothing to do by far. Wait when H&S shape will be completed and consider top of right arm or 3-Drive "Sell" pattern for short entry.

SOL/USDT 4HInterval Resistance and SupportHello everyone, let's look at the SOL to USDT chart on a 4-hour timeframe. As you can see, the price is moving below the local downtrend line.
Let's start with the support line and as you can see the first support in the near future is $22.52, if the support is broken then the next support is $21.27 and $19.67.
Now let's move on to the resistance line, as you can see the first resistance is $23.57, if you manage to break it, the next resistance will be $24.25, $24.93 and $25.88.
Looking at the CHOP indicator, we see that the energy is slowly starting to rise, the MACD indicates entering a local uptrend, while the RSI shows a quick return to the middle of the range.

EURAUD I Weekly Forecast & How to Trade ItWelcome back! Let me know your thoughts in the comments!
**EURAUD Analysis - Listen to video!
We recommend that you keep this pair on your watchlist and enter when the entry criteria of your strategy is met.
Please support this idea with a LIKE and COMMENT if you find it useful and Click "Follow" on our profile if you'd like these trade ideas delivered straight to your email in the future.
Thanks for your continued support!

Result of Previous Idea | 140pips GBPUSD | What's Next?Welcome back traders. Here's the result of our previous idea. It was published on February 21 and target reached on February 24.. some 140pips..
Explaining the trade generally:
•Open your chart on GBPUSD Daily frame and mark the exact FVG I marked above and in previous idea..
•Look at the bodies of candles after reaching the FVG.. Ignore the tails of candles that tried to trick traders in longs.
•Open H1 chart and mark the first FVG you see after reaching Daily FVG..(22Feb, 03:00)
•What time is London Open Killzone?
•Do you see how many FVGs we got on H1 and lower time frames(15m,5m,3m,1m)?
•See the opportunities that price offered in active market times (Killzones)..
Want more? Show your Likes👍
Something not clear? Tell me in comments ✍️
