easyMarkets NASDAQ Daily - Quick Technical OverviewDisclaimer:
easyMarkets Account on TradingView allows you to combine easyMarkets industry leading conditions, regulated trading and tight fixed spreads with TradingView's powerful social network for traders, advanced charting and analytics. Access no slippage on limit orders, tight fixed spreads, negative balance protection, no hidden fees or commission, and seamless integration.
Any opinions, news, research, analyses, prices, other information, or links to third-party sites contained on this website are provided on an "as-is" basis, are intended only to be informative, is not an advice nor a recommendation, nor research, or a record of our trading prices, or an offer of, or solicitation for a transaction in any financial instrument and thus should not be treated as such. The information provided does not involve any specific investment objectives, financial situation and needs of any specific person who may receive it. Please be aware, that past performance is not a reliable indicator of future performance and/or results. Past Performance or Forward-looking scenarios based upon the reasonable beliefs of the third-party provider are not a guarantee of future performance. Actual results may differ materially from those anticipated in forward-looking or past performance statements. easyMarkets makes no representation or warranty and assumes no liability as to the accuracy or completeness of the information provided, nor any loss arising from any investment based on a recommendation, forecast or any information supplied by any third-party.
Daily Charts

LITUSDT Weekly S/R| .618 Fibonacci| Price Action| Trend Evening Traders,
Today’s analysis – LITUSDT – rejecting from its .618 Fibonacii and is now trading below key resistance,
Points to consider,
- Price action impulsive
- Daily S/R Resistance
- Weekly S/R Support
- Price Action Range
LITUSDT’s immediate price action is trading under resistance, as long as price stay below, it is likely to trade lower.
The Weekly S/R is the immediate support, holding this area will create a local price action range, allowing for potential accumulation.
How price action trades within the range will dictate the immolate direction
Overall, in my opinion, LITUSDT needs form a constructive range before the next expansion
Hope this analysis helps,
Thank you for following my work
And remember,
“Once you find the system that works for your style/personality and confidence is gained, wash, rinse, repeat over and over again.” – Sunrisetrader

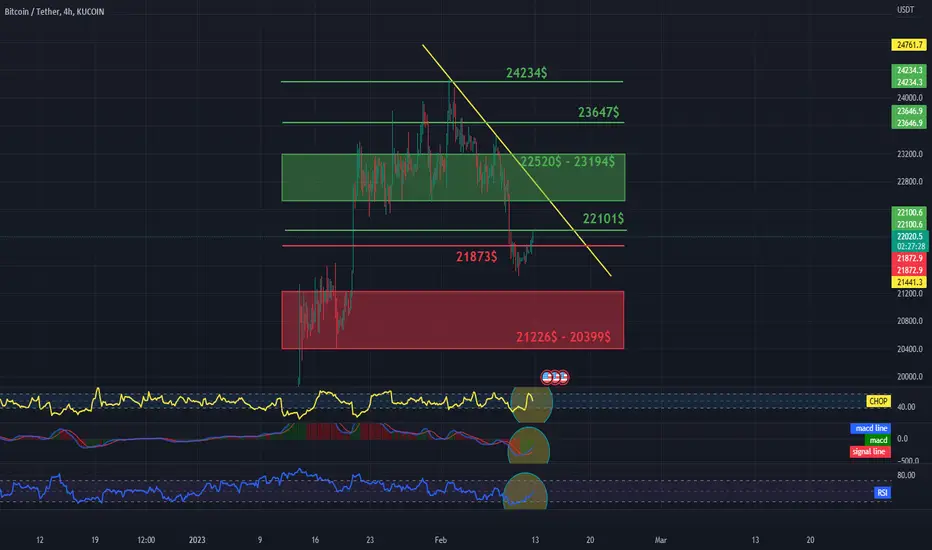
Daily review of BTC interval 4HHello everyone, let's look at the BTC to USDT chart on a 4-hour timeframe. As you can see, the price is moving below the local downtrend line.
Let's start with the support line and as you can see the first support in the near future is $21873, if the support is broken then we have a support zone from $21226 to $20399.
Now let's go from the resistance line, as you can see the first resistance is $22,101, if we manage to break it, then we have a strong resistance zone from $22,520 to $23,194, then resistance at $23,647 and $24,234.
Looking at the CHOP indicator, we see that there is still a lot of energy left for a further move, the MACD indicates entering a local uptrend, while the RSI shows an increase and room for the next move.
Daily review of BTC interval 4HHello everyone, I invite you to review the chart of BTC vs USDT, taking into account the four-hour interval. First, we will use the yellow line to mark the local uptrend line from which the price went down.
Now we can move on to marking the support and here in the first place it is worth marking the support zone from $ 21239 to $ 20421, but when we fall below this zone, we can see a drop even around $ 18041.
Looking the other way, in a similar way using the Fib Retracement tool, we can determine the places of resistance. And here we have the first resistance at the price of $22158, when it manages to break it, the price will have to break through the strong zone from $22581 to $23662. Once this zone is broken, the price will move towards its latest high at $24,261.
Please note the CHOP index which indicates that the energy has been used up and is slowly starting to rise, the MACD indicator indicates a downtrend, while the RSI indicator is moving at the lower end of the range.

Daily review of ETH interval 4HHello everyone, let's look at the ETH to USDT chart on the 4-hour time frame. As you can see, the price has fallen below the local uptrend channel.
Let's start with setting support and here we immediately see that the price is in a strong support zone from $ 1560 to $ 1518, if the price goes lower we can see a quick drop to around $ 1396.
Now let's move on to the resistance ETH is facing, we can see that we have a strong resistance zone from $1621 to $1674, then it will meet resistance at $1716.
Looking at the CHOP indicator, we can see that the energy has been used up for the last fall, the MACD indicates a local downtrend, while the RSI has touched the lower range, which gives us room for new highs.

NZDCHF I Local short from resistance zone Welcome back! Let me know your thoughts in the comments!
**NZDCHF Analysis - Listen to video!
We recommend that you keep this pair on your watchlist and enter when the entry criteria of your strategy is met.
Please support this idea with a LIKE and COMMENT if you find it useful and Click "Follow" on our profile if you'd like these trade ideas delivered straight to your email in the future.
Thanks for your continued support!

NASDAQ looking up 🦐NAS100USD on the daily chart has created a triple bottom.
The market tested a few times the weekly support at the 10700 level and we notice how after the first 2 tests the market went up for a distribution phase.
It is interesting to see the liquidity grab before the next bearish leg to the support where, also thanks to the recent news we had a new inversion at the support level .
How can i approach this scenario?
IF the price will break above the resistance area we can set a nice long order according to the Plancton's strategy rules.
–––––
Follow the Shrimp 🦐
Keep in mind.
🟣 Purple structure -> Monthly structure.
🔴 Red structure -> Weekly structure.
🔵 Blue structure -> Daily structure.
🟡 Yellow structure -> 4h structure.
⚫️ Black structure -> <4h structure.
Here is the Plancton0618 technical analysis , please comment below if you have any question.
The ENTRY in the market will be taken only if the condition of the Plancton0618 strategy will trigger.

23-23.1KMorning everybody,
So, as we are watching for pullback on EUR, GBP, Gold and other assets, we do not see any reasons to step aside from our scenario here. Our Monday's setup was completed well, as BTC once again has shown upside AB-CD retracement. That's why we consider another one, somewhere to 23-23.1K resistance area

easyMarkets NASDAQ Daily - Quick Technical OverviewDisclaimer:
easyMarkets Account on TradingView allows you to combine easyMarkets industry leading conditions, regulated trading and tight fixed spreads with TradingView's powerful social network for traders, advanced charting and analytics. Access no slippage on limit orders, tight fixed spreads, negative balance protection, no hidden fees or commission, and seamless integration.
Any opinions, news, research, analyses, prices, other information, or links to third-party sites contained on this website are provided on an "as-is" basis, are intended only to be informative, is not an advice nor a recommendation, nor research, or a record of our trading prices, or an offer of, or solicitation for a transaction in any financial instrument and thus should not be treated as such. The information provided does not involve any specific investment objectives, financial situation and needs of any specific person who may receive it. Please be aware, that past performance is not a reliable indicator of future performance and/or results. Past Performance or Forward-looking scenarios based upon the reasonable beliefs of the third-party provider are not a guarantee of future performance. Actual results may differ materially from those anticipated in forward-looking or past performance statements. easyMarkets makes no representation or warranty and assumes no liability as to the accuracy or completeness of the information provided, nor any loss arising from any investment based on a recommendation, forecast or any information supplied by any third-party.

Daily review of BTC interval 1HHello everyone, let's look at the BTC to USDT chart on a 1-hour time frame. As you can see, the price is moving below the local downtrend line.
Let's start with the support line and as you can see the first support in the near future is $22827, if the support is broken then the next support is $22626, $22430 and $22158.
Now let's move on to the resistance line, as you can see the first resistance is $23044, if you manage to break it, the next resistance will be $23300, $23511 and $23718.
Looking at the CHOP indicator, we see that the energy has been used, the MACD indicates a downtrend, while the RSI indicates a strong reaction, which creates room for increases.

GBPUSD - SHORT! 4h currently sitting in high demand area. uptrend daily trendline has broken, looking for that retest to happen on the support area of the trendline and wait for a confirmation signal to sell!
my targets have been placed!

2/6/23 - SPY AnalysisIn this Monday video I go over multiple time frames of the SPY and what my thoughts are.

19.5-20K is a moment of truthMorning everybody,
We have hoped that BTC completes 25K butterfly on daily chart, but it seems that situation turns different. Still, this is not vital, but technically it would be perfect, if this would happen. Anyway, as we expect that downside action continues on other assets, as we do on BTC. In nearest term we expect minor upside bounce (as on EUR, Gold as well), but then downside action should continue by our view.
On daily chart (not shown here) we have DiNapoli DRPO "Sell" pattern. Here, on 2H chart, performance takes the shape of round top with multiple upside AB-CD's. So, hopefully this sequence continues, and once pullback will be done, we get another downside extension.
All in all, we're mostly watching for 19.5-20K downside target, because this is potential bottom of the reverse H&S right arm on weekly chart. This is the level where the major perspective will be determined...
Now it is just tactical fluctuations...
Oh, yes - now we do not consider any bullish positions. Daily trend is bearish...

CHFJPY I It will fall from resistance 100 pipsWelcome back! Let me know your thoughts in the comments!
**CHFJPY Analysis - Listen to video!
We recommend that you keep this pair on your watchlist and enter when the entry criteria of your strategy is met.
Please support this idea with a LIKE and COMMENT if you find it useful and Click "Follow" on our profile if you'd like these trade ideas delivered straight to your email in the future.
Thanks for your continued support!

AUDUSD I It will grow from support BUY!Welcome back! Let me know your thoughts in the comments!
**AUDUSD Analysis - Listen to video!
We recommend that you keep this pair on your watchlist and enter when the entry criteria of your strategy is met.
Please support this idea with a LIKE and COMMENT if you find it useful and Click "Follow" on our profile if you'd like these trade ideas delivered straight to your email in the future.
Thanks for your continued support!

AUDCHF I Local buy from support 60 pipsWelcome back! Let me know your thoughts in the comments!
**AUDCFH Analysis - Listen to video!
We recommend that you keep this pair on your watchlist and enter when the entry criteria of your strategy is met.
Please support this idea with a LIKE and COMMENT if you find it useful and Click "Follow" on our profile if you'd like these trade ideas delivered straight to your email in the future.
Thanks for your continued support!

EURCAD I More decline to the downside Welcome back! Let me know your thoughts in the comments!
**EURCAD Analysis - Listen to video!
We recommend that you keep this pair on your watchlist and enter when the entry criteria of your strategy is met.
Please support this idea with a LIKE and COMMENT if you find it useful and Click "Follow" on our profile if you'd like these trade ideas delivered straight to your email in the future.
Thanks for your continued support!

Daily review of BTC interval 1HHello everyone, let's look at the BTC to USDT chart on a one hour time frame. As you can see, the price is moving in the local uptrend channel.
Let's start with the support line and as you can see the first support in the near future is $23542, if the support is broken then the next support is $23364, $23124 and $22810.
Now let's go to the resistance line, as you can see the first resistance is $23635, if you manage to break it, the next resistance will be $23893, $24099 and $24315.
Looking at the CHOP indicator, we see that there is a lot of energy that is being used for the current increase, the MACD is on the verge of entering a local uptrend, while the RSI indicates a rebound and room for further increases.

Daily review of ETH interval 4HHello everyone, I invite you to review the chart of ETH in pair to USDT, on a four-hour interval. First of all, using the blue lines, we can mark the uptrend channel in which the price is currently moving.
Now let's move on to marking the places of support. We will use the Fib Retracement tool to mark the supports, and as you can see we have the first support at $1562, the second support at $1468, the third at $1392, and then we can mark the strong support zone from $1319 to $1208.
Looking the other way, we can also mark the places where the price should encounter resistance on the way to increases. And here we have the first very strong resistance at the price of $1666 which is the so-called golden point of 0.618 Fib, the next resistance is at the price of $1827 and then the third resistance at the price of $2032.
When we turn on the EMA Cross 10 and 30, we can see that they indicate an uptrend. The CHOP index indicates that the energy has been used. The MACD indicator is on the verge of entering a local downtrend. On the other hand, we see a rebound on the RSI, but we remain in an uptrend.

Daily review of BTC interval 4HHello everyone, I invite you to review the current situation on the BTC pair to USDT, taking into account the four-hour interval. First, we will use blue lines to mark the local uptrend channel in which the BTC price is moving.
Now we can move on to marking the places of support in the event of a correction. And here, in the first place, it is worth marking the support zone from $ 23,361 to $ 22,779, but when we fall below this zone, we can see a drop to around $ 21,883 and even $ 20,406.
Looking the other way, in a similar way, using the trend based fib extension tool, we can determine the places of resistance. First, we will mark the resistance zone from $23,769 to $24,209, when we manage to break it, we have a second zone from $24,445 to $24,744. Once these two zones are broken, we will move towards resistance at $25,121 and then $26,221.
Please pay attention to the CHOP index which indicates that most of the energy has been used, the MACD indicator indicates entering a local downtrend, while the RSI shows a visible rebound, which may give room for new increases.

DXY Daily:03/02/2023:🔴Important levels and possible scenarios🔴
As you can see, the price is in the important zone that can specify the next move from here.
If the price can stay above 99.64 we expect the first scenario.
Please pay attention to the details.
💡Wait for the update!
🗓️03/02/2023
🔎 DYOR
💌It is my honor to share your comments with me💌

GBPAUD I Correction and bearish continuationWelcome back! Let me know your thoughts in the comments!
**GBPAUD Analysis - Listen to video!
We recommend that you keep this pair on your watchlist and enter when the entry criteria of your strategy is met.
Please support this idea with a LIKE and COMMENT if you find it useful and Click "Follow" on our profile if you'd like these trade ideas delivered straight to your email in the future.
Thanks for your continued support!

AUDUSD LONGFX:AUDUSD
Bullish movement on AUDUSD. Price broke above the Daily resistance and made a pullback to retest at the previous resistance now turned into support. Price even retraced to the 38.2% Fibonacci retracement. An engulfing candle on the lower timeframes (30min,15min) is confirmation to go long on AUDUSD
