Daily review of BTC interval 1HHello everyone, let's look at the BTC to USDT chart on a 1-hour time frame. As you can see, the price is moving below the local downtrend line.
Let's start with the support line and as you can see the first support in the near future is $22985, if the support is broken then the next support is $22774 and $22601.
Now let's move to the resistance line, as you can see the first resistance is $23040, if you manage to break it, the next resistance will be $23213, $23381 and $23624.
Looking at the CHOP indicator, we see that we have a lot of energy for a new move, the MACD indicates a local downtrend, while the RSI is moving around the middle of the range in a local downtrend.
Daily Charts

Daily review of ETH interval 4HHello everyone, let's look at the ETH to USDT chart on the 4-hour timeframe. As you can see, the price is moving in the channel marked with yellow lines.
Let's start with the support line and as you can see the first support in the near future is $1576, if the support is broken then the next support is $1557, $1542 and $1527.
Now let's go to the resistance line, as you can see the first resistance is $1607 where the price turned around, the next resistance will be $1623, $1647 and $1678.
Looking at the CHOP indicator, we see that energy has been used for the recent move, the MACD indicates a local downtrend, while on the rsi we see a rebound after a rebound.

USDCHF Daily: 18/01/2023: Will collect liquidity?
Main idea:
Well, based on the weekly TA we can expect the following idea.
If you have a question feel free to ask.
💡Wait for the update!
🗓️18/01/2023
🔎 DYOR
💌It is my honor to share your comments with me💌

Daily review of BTC interval 4HHello everyone, I invite you to review the chart of BTC vs. USDT on a four-hour timeframe. As we can see, the price is moving in the local pattern trend channel.
Now let's move on to marking the support points that the price has in case of further declines. And we can see that the first support is at $22955, the second support at $22679, if the price goes lower we can see a drop to around $21873 in line with the pattern being formed.
Looking the other way, in a similar way, we can determine the places of resistance that the price has to face. As you can see, we have the first resistance at $23,305, the second resistance at $23,509, the third resistance at $23,663, and then a strong resistance zone from $23,842 to $24,078.
It is worth watching the EMA Cross here, because we can see that the red EMA Cross 10 line turns around and when it crosses the green EMA Cross 30 line from above, we can see the entry into a downtrend.
The CHOP index indicates that the energy is gathering strength, the MACD indicates a local downtrend, while the RSI has a healthy rebound, which may make room for new increases.

23.3-23.5 is a control levelMorning everybody,
BTC now has no technical barriers for upward action to our major 25-25.5K destination point. Its not at overbought and has no Fib resistance levels ahead. Still, we have tough week with multi central banks decision, NFP and other stuff. And some external factor intruding could hurt bullish tendency.
In nearest term, we think we have to keep an eye on 23.3-23.5K area. BTC should not break it down, if upside context is valid. Scalp traders could consider long entry around it and 5/8 level of 22.5K. But for daily traders I would wait for major pullback out from 25 K resistance but not consider long entry right now.

SWING TRADING: USDCAD BUY LIMIT ORDER. TARGET 1.35670TRADE TYPE: BUY LIMIT
TRADE DIRECTION: LONG
TIMEFRAME: DAILY
ENTRY PRICE: 1.34380
STOP LOSS: 1.33100
TAKE PROFIT: 1.35670
RISK TO REWARD: 1:1
ANALYSIS: Price broke the supply zone comfortably and now shall look to aim towards the upcoming supply zone . stop loss ideally placed below swing low.
Follow this thread for any future updates regarding this specific trade.
CAUTION: Trading is a Probability Game and could wipe out your account if risk management and strategy is not followed properly. Cheers

Daily review of BTC interval 4HHello everyone, let's look at the BTC to USDT chart on a 4-hour timeframe. As you can see, the price is moving in a triangle marked with yellow lines.
Let's start with the support line and as you can see the first support in the near future is $23003, if the support is broken then the next support is $22846, $22700 and $22480.
Now let's go from the resistance line, as you can see the first resistance is $23092, if you manage to break it the next resistance will be $23270, $23447 and $23698.
Looking at the CHOP indicator, we see that there is still energy for a new move, the MACD indicates a local downtrend, while the RSI has a rebound and is moving in a downtrend.

Daily review of ETH interval 4HNow let's move on to the chart of ETH against USDT, also on a four-hour time frame. And here we can start by identifying with the yellow lines the triangle in which the price is moving.
Going further, we see that we have the first support at $1602, the second support at $1579, the third at $1560, the fourth at $1540 and the fifth at $1514.
Looking the other way, we can also identify places where the price may encounter resistance. And here we have the first resistance at $1613, the second resistance at $1628, the third at $1648 and the fourth at $1675.
As we can see, EMA Cros indicated entering a local downtrend, but now it should be observed whether EMA Cross red 10 will cross the green line from below, which may be a confirmation of entering a local uptrend.
The CHOP index indicates that we have more and more energy for the next move, the MACD indicates entering a local uptrend, while the RSI has changed the direction of the trend to an upward one.

US100 Daily analysisHi Traders
Todays analysis on US100, on the daily chart. You can see that price made a huge double bottom, made up from 2 separate double bottoms as ssen in the chart. This is a strong trend reversal, and leaves us open for a possible long swing trade. Price has made the double bottom and made the first push up, as you can see, the previous daily close gave us a strong engulfing going long, after 2 bearish sticks, signaling a retest of the double bottom pattern, which 9 times out of 10 will send you rocketing to confirm the market reversal


Daily review of BTC interval 4HHello everyone, let's look at the BTC to USDT chart on a 4-hour time frame. As you can see, the price is moving above the local uptrend line.
Let's start with the support line and as you can see the first support in the near term is $22972, if the support is broken the next strong support is at $22439.
Now let's move to the resistance line, as you can see the first resistance is $23211, if you manage to break it the next resistance will be $23430, $23605 and $23780.
Looking at the CHOP indicator, we see that most of the energy has been used up, the MACD is close to entering a local uptrend, while the RSI indicator is moving at the upper end of the range, which may indicate a small correction.

Better to sit on the handsMorning everybody,
So, overall tendency and sentiment is positive on BTC market (although we're skeptic on major reversal idea due to fundamental reasons). Technically market should not have any big problems to reach 25.5K area - next solid resistance.
But, there few moments that make it tricky. First is, as EUR as Gold now stand at strong resistance areas. EUR is at 1.0942 weekly 50% Fib level, while gold is at 1950 monthly overbought. Second - today we get GDP and PCE numbers. If they will be poor, investors will be scared of recession that will trigger demand for US Dollar, at least in short term.
That's why, by these reasons, and also because here, on 4H chart we also have some signs of weakness, we prefer to wait for some pullback.

Bitcoin support and resistance for daily tradingHere's four levels of support and resistance to apply based on pvsra high volume candle.
Enjoy your trading !

25.2-25.9KMorning guys,
We have big doubts on long-term upside reversal due fundamental reasons. Meantime, short-term context is bullish. Now we consider 25.2-25.9K resistance as nearest destination point. 22.22K and 21.30-21.50K supports could be considered for position taking. Be aware of statistics this week- Durable orders, GDP, PCE.

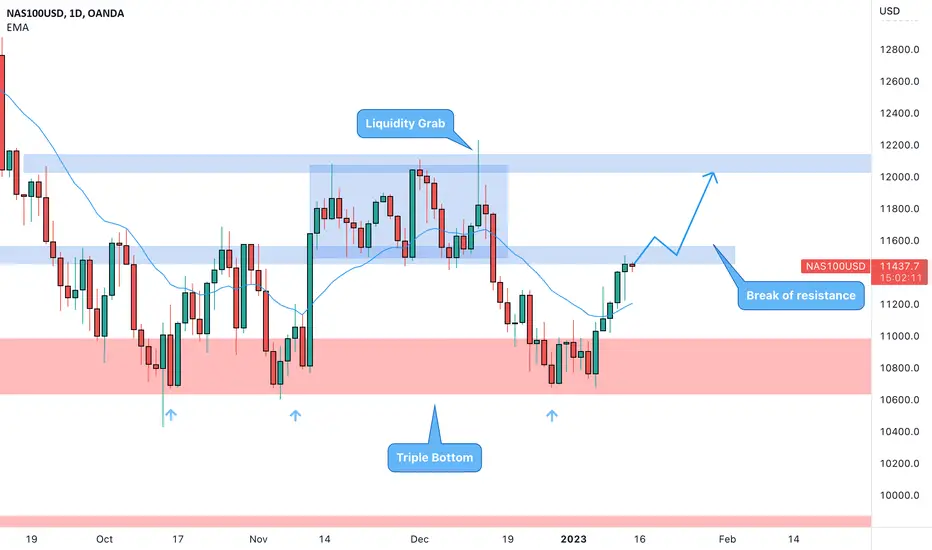
NASDAQ can move higher? 🦐NAS100USD on the daily chart has created a triple bottom.
The market tested a few times the weekly support at the 10700 level and we notice how after the first 2 tests the market went up for a distribution phase.
It is interesting to see the liquidity grab before the next bearish leg to the support where, also thanks to the recent news we had a new inversion at the support level.
How can i approach this scenario?
Being Friday it will be risky to open a position but IF the price will break above the resistance area we can set a nice long order according to the Plancton's strategy rules.
–––––
Follow the Shrimp 🦐
Keep in mind.
🟣 Purple structure -> Monthly structure.
🔴 Red structure -> Weekly structure.
🔵 Blue structure -> Daily structure.
🟡 Yellow structure -> 4h structure.
⚫️ Black structure -> <4h structure.
Here is the Plancton0618 technical analysis , please comment below if you have any question.
The ENTRY in the market will be taken only if the condition of the Plancton0618 strategy will trigger.
USDJPY I Up 260 Pips! Short coming soonWelcome back! Let me know your thoughts in the comments!
**USDJPY Analysis - Listen to video!
We recommend that you keep this pair on your watchlist and enter when the entry criteria of your strategy is met.
Please support this idea with a LIKE and COMMENT if you find it useful and Click "Follow" on our profile if you'd like these trade ideas delivered straight to your email in the future.
Thanks for your continued support!

EURCAD for a new high 🦐EURCAD on the daily chart is trading below a weekly resistance at the recent high.
The price after the last impulse retraced perfectly at the 50% of the previous impulse over a daily support and moved back to the previous high.
How can i approach this scenario?
I will wait for a clear break of the structure and if that will happen i will move on the 4h timeframe to look for a nice long order according to the Plancton's strategy rules.
--––
Follow the Shrimp 🦐
Keep in mind.
🟣 Purple structure -> Monthly structure.
🔴 Red structure -> Weekly structure.
🔵 Blue structure -> Daily structure.
🟡 Yellow structure -> 4h structure.
⚫️ Black structure -> <4h structure.
Here is the Plancton0618 technical analysis , please comment below if you have any question.
The ENTRY in the market will be taken only if the condition of the Plancton0618 strategy will trigger.

GBPUSD I Short from channel resistance
Welcome back! Let me know your thoughts in the comments!
**GBPUSD Analysis - Listen to video!
We recommend that you keep this pair on your watchlist and enter when the entry criteria of your strategy is met.
Please support this idea with a LIKE and COMMENT if you find it useful and Click "Follow" on our profile if you'd like these trade ideas delivered straight to your email in the future.
Thanks for your continued support!

USDJPY I Potential buy from demand zoneWelcome back! Let me know your thoughts in the comments!
**USDJPY Analysis - Listen to video!
We recommend that you keep this pair on your watchlist and enter when the entry criteria of your strategy is met.
Please support this idea with a LIKE and COMMENT if you find it useful and Click "Follow" on our profile if you'd like these trade ideas delivered straight to your email in the future.
Thanks for your continued support!

Pullback to 19-19.45K area Morning folks,
So, BTC rally has been triggered by FTX news, that they have recovered $5Bln for clients and later was supported by common euphoria around CPI numbers. In our weekly FX report we've explained why it is temporal and soon everything returns back to its own. But, market likes to follow wishful thinking. Anyway, we have bullish context. Last time we've agreed to watch for 19.1K area resistance, were waiting for some response. It has not happened, and this makes us to switch to next, XOP target that market has hit recently.
Now price stands at 1.618 AB-CD extension, at overbought and near 21.6K Fib resistance. Definitely it is not the moment for position taking and we need to wait for pullback. Now we consider 19-19.45K levels, as most probable destination of retracement. Still, we also do not exclude possible reverse H&S pattern. In this case pullback could reach 18.3-18.5K level.
For the bears it is nothing to do by far, unless you're trading on intraday charts.

ATOMUSD Daily S/R Resistance| VAH| .618 Fibonacci
Evening Traders,
Today’s analysis – ATOMUSD- trading towards a key resistance zone where a rejection is likely,
Points to consider,
- Price Action Corrective
- Daily S/R Resistance
- VAH Resistance
- .618 Fibonacci Resistance
ATOMUSDT’s immediate price action is at an area of resistance compromised of the .618 Fibonacci, Daily S/R and the Value Area High, this allows for a bearish bias.
A rejection here will continue the bearish trend by establishing another lower high.
The overall target is the POC and level that will confirm the next higher low if price action finds support.
Hope this analysis helps!
Thank you for following my work
And remember,
“You have power over how you'll respond to uncertainty.”
― Yvan Byeajee,

On Daily TF BTC is bullishBTC seems to be in very bullish mode, not sure if its fake out or not, but I can see stronger momentum in this leg up than the what we had in last few months.
This is good sign for the hopefuls like me, who have been on positive side of the BTC.
On weekly also it has shown strong signs of possible break out.

VIX Daily - 01132023 BreakdownVIX Daily represented in a Symetrical Triangle coming into the pattern from a bearish stance. This generally signifies a continuation pattern as it has on this chart. Its odd to see the VIX dropping while the SPX is also dropping today. Lets see if that holds. We may get BTD going on and the VIX may retest the pattern as it should.
