17.5 then 12.8K?Morning folks,
BTC once again confirms our long-term view. Those who read our fundamental reports do not buy BTC. Of course we can't foresee the reasons why it happens, but even fundamental background stands against long-term investment in crypto currencies.
Thus, our 16.5K target is done, which is also 1.27 extension of daily/weekly butterfly. Since BTC is not oversold and it has no solid support levels, now we see short-term pause due to speculators' booking. Supposedly retracement could reach 17.5-17.8 Fib resistance area and re-test broken consolidation border.
Our next target is 12.5-12.8K, which is major weekly AB=CD target and butterfly 1.618 extension (not shown here).
Take care,
S.
Daily Charts

XAUUSD testing a confluence 🦐GOLD on the daily chart found a support area in the downtrend.
The price is moving inside a descending channel and currently is testing a confluence zone between the upper trendline and a resistance area.
According to Plancton's strategy IF the price will break above we will set a nice long order.
--––
Follow the Shrimp 🦐
Keep in mind.
🟣 Purple structure -> Monthly structure.
🔴 Red structure -> Weekly structure.
🔵 Blue structure -> Daily structure.
🟡 Yellow structure -> 4h structure.
⚫️ Black structure -> <4h structure.
Here is the Plancton0618 technical analysis , please comment below if you have any questions.
The ENTRY in the market will be taken only if the condition of the Plancton0618 strategy will trigger

dollar 120 ?dollar index is making higher high with higher lower between white trend lines
from last peak it has made a abcde elliott wave triangle
so key support level 109.600 which is testing both yellow and white trend line at the same time
if support breaks than peak dollar (as cramer said on 24 October ) confirmed which translate into end of fed QT ( while inflation is still high).
if support holds than 120 next high is coming ,
since dollar strength is driving everything so need to mention gold and euro

21.15K seems to be vtialMorning folks,
BTC mostly stands in the same area, but still was able to complete our intraday XOP target around 21.6. Now it is not good idea to forecast something, as we should get elections result and CPI numbers, but, based on technical picture, it seems, the top of right arm, around 21.15K will be vital for both sides.
If H&S starts to work, BTC will go to the daily lows, and potentially lower. Conversely, H&S Failure and move above the top of right arm shold open road for higher upward action.
Correspondingly, bears could watch for minor bearish patterns on 15 min chart around 21.15K area to consider short entry and stop placement, while bulls should wait for the opposite - upside action back to the head's top will become a signal for position taking.

Daily review of BTC interval 4HHello everyone, let's take a look at the BTC to USDT chart, in the 4 hour timeframe. As you can see, the price is moving above the local uptrend line.
Let's start with the designation of the support line and as you can see the first support in the near future is $ 21,235, if the support breaks down, the next support is $ 21,075, $ 20,954 and $ 20,834.
Now let's move to the resistance line as you can see the first resistance is $ 21,559, if you can break it the next resistance will be $ 21,773, $ 21,945 and $ 22,177.
Looking at the CHOP indicator, we can see that the energy has been used up in the 4-hour interval, and the MACD indicator shows a local upward trend.

GBPUSD Longs!Gameplan is to buy GBP. Yes, we still have a major bear down trend on weeklies and daily. On daily we have been forming higher lows & higher highs, with retest of current support + a nice bullish break. What would have made this trade IDEAL would've been fully engulfing daily bull candle to offset all the bear volume. If you look at the weekly, price is overextended and in need of a retracement before another bearish move can be made.
On the daily, we have short term bullish structure forming and we have just held newly established support and made a good bullish break - very healthy bull candles coming off close to support shows plenty of momentum for GBPUSD in the week to come.

Daily review of BTC interval 4HHello everyone, let's take a look at the BTC to USDT chart over the 4 hour timeframe. As you can see, the price is moving in the downtrend channel marked with blue lines.
Let's start with the designation of the support line and as you can see the first support in the near future is $ 20,507, if the support breaks down, the next support is $ 20,393, $ 20,304 and $ 20,212.
Now let's move to the resistance line as you can see the first resistance is $ 20,632, if you can break it the next resistance will be $ 20,729, $ 20,811 and $ 20,886.
Looking at the CHOP indicator we can see that in the 4-hour interval we have a lot of energy for the next move, while the MACD incident indicates a local upward trend.

Speculative double bottom on digibyteDigibyte has done nothing to show that its about to reverse its downtrend yet, however we are starting to see the inklings of a possible double bottom forming. This is still so early in the pattern that its almost pure speculation on my part at this point. You should never try to trade a pattern until it has confirmed either a breakout or a breakdown. Although this could easily end up a fakeout that sends digibyte lower continuing its downtrend, with so many alts recently seeing bullish surges there is certainly a chance this double bottom could end up playing out. If it were to it would be close to a 180% gain from this level. WE can see there is also a possibility here in the near future of a golden cross. The fact that many other alt coins have recently seen successful golden crosses with QNT leading the way, gives us bullish confluence that increases the probability that digibyte could also experience a successful golden cross in the near future. Still mostly speculation at this point, but just enough bullish confluence to keep an eye on this one and see how it develops. *not financial advice*

Back to neutral, with a tighter squeeze now.I am still waiting for another long position since March when we were at 47.5k!
We are back in the neutral zone yet again with the bands constricting tighter around the center. The red resistance band up top is crashing down, while the support zone below DOUBLE bands. The support is looking stronger, and I am leaning towards long here, but not yet.
We are entering November, December which is usually Bear months. I still need more confirmation that the current price can push towards the resistance.

Fed puts bearish backgroundMorning folks,
So, the Fed decision should not become a surprise for those who read our BTC fundamental reports. In last two weeks we've spent time for in-depth analysis to whether Fed stands near the pivot or not. And have come to conclusion that Fed remains tight, terminal rate should increase 4.5-4.75% widely anticipated level and move above 5%. Recent Fed statement was hawkish and puts bearish background for BTC market.
BTC shows weaker reaction compares FX and gold market mostly because it has lost 60% of its capitalization and rest speculators have not enough funds to trigger big moves. Now, despite BTC stands by far above 20K area, we do not consider taking any new long positions and suggests that advantage stands on a bears' side.
P.S.
NFP also hardly makes impact on market performance. Because, indirectly, due to the Fed's tone, we could suggest that NFP numbers should somewhere around expectations.

BTC inverse Adam & EveDouble bottom in falling wedge on BTCUSDT on daily ?
Confirmation over 24.4k-25.3k range.
1. Double bottom target is 32k
2. Second target should be the 0.786,0.886 fib zone of previous wave down B-C
3. 56k final measured move of the falling wedge.
The stop loss should be around the 19k level

BTCUSDT 01 Nov 2022 Long Term Analysis (Daily)Following a large number of requests here is my 01 November 2022 long term $BTC / $USDT analysis. #BTC
I have made this analysis of the BTC USDT in order to determine a safe entry point for a long term investment.
To date (01 Nov 2022) I have deduced that the market offers two scenarios. The first one (the most likely one in view of the geopolitical and economic conditions from a macroeconomic point of view) would be a continuation of the decline. I estimated the latter using the Crypto Fear & Greed Index of the alternative.me website with a 70% chance of realization.
The second, less likely scenario would be following the pump that we had this week a reversal of the trend in order to go back up on the long term. 30% chance of success.
I have determined that the red scenario has a better chance of happening for various reasons:
- Firstly the global economic conditions do not allow for a bullish reversal.
- Secondly, we have a bearish divergence in the daily chart this week.
- Thirdly the $18500 / $22500 range has not had a confirmed breakout with enough volume to speak of a long term reversal.
- Fourth, the failure of last week's pump at the $20,800 resistance.
At this time with the information we have I recommend not to buy BTC.
Of course I would like to remind you that I am not a fortune teller, nobody can know how the market will behave. However, we can analyze it and with the help of the past and statistics, try to find the best entry and exit points
However, if you have any questions, I remain at your disposal in the comment space.
THIS IS NOT INVESTMENT ADVICE

DXY on a pause? 🦐DXY on the daily chart is coming from a series of powerful high highs higher lowes and the main trend is surely bullish.
The market anyway might be looking for a pause and on the chart we can see hoe the support trendline has been tested now.
How can i approach this scenario?
I will monitor the market during the US session and if the price will break and close below the area i will consider a short on the US pairs.
––––
Follow the Shrimp 🦐
Keep in mind.
• 🟣 Purple structure -> Monthly structure.
• 🔴 Red structure -> Weekly structure.
• 🔵 Blue structure -> Daily structure.
• 🟡 Yellow structure -> 4h structure.
• ⚫️ Black structure -> >4h structure.
Here is the Plancton0618 technical analysis , please comment below if you have any question.
The ENTRY in the market will be taken only if the condition of the Plancton0618 strategy will trigger

Market Bias & Top Stock Watches - 10/31/2022Bias: Inside day, bearish chop.
Top Watches: Long - CCL, GME, WYNN, SOFI, ROKU, LVS, ET. Short - TSP, HBI, GOGL, FB, SNOW
Follow my page for daily pre-market reviews and trade ideas.

20K is VitalMorning folks,
So, BTC has started nice with upside breakout of the range, re-tested the border. But now it can't proceed higher to 20.6K target. Although, if it is really bullish, it should to. The reason for that is the Fed - they start more actively contract the ballance sheet trying to come up with the promised values of bonds' sell of. Thus, last week finally 20 Bln in MBS have been sold. Now QT plan is completed for ~65%, but they are accelerating.
You know our bearish view on BTC. Fed is no near the pivot yet. Technical picture shows that bullish context is becoming weaker. Maybe some external drivers, such as Fed comments or NFP data this week could push it higher to complete 20.6K, but as it stands right now - I'm not fascinating with taking the long position.
We suggest that 20K lows are vital here. Downside breakout could be treated as a signals to step in for the bears.

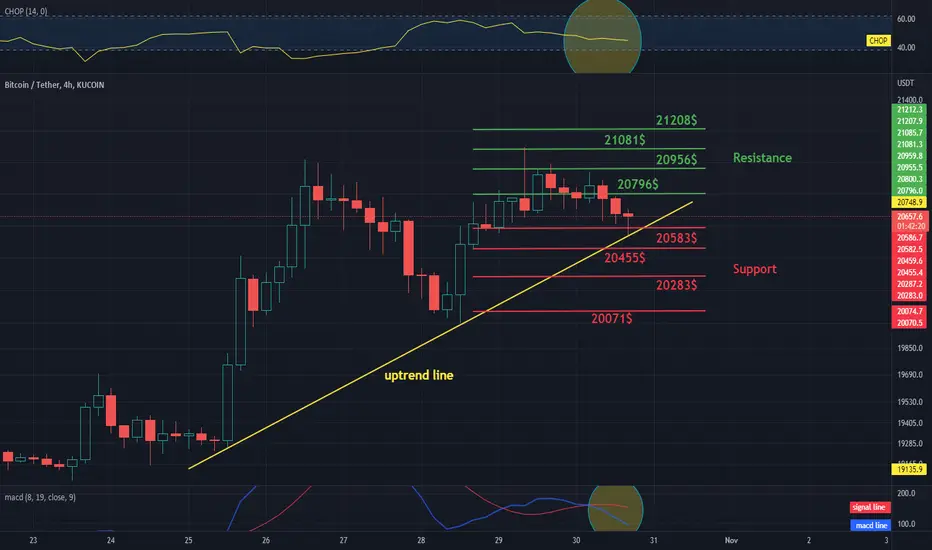
Daily review of BTC interval 4HHello everyone, let's take a look at the BTC to USDT chart over the 4 hour timeframe. As you can see, the price is moving above the uptrend line.
Let's start with the designation of the support line and as you can see the first support in the near future is $ 20,583, if the support breaks down, the next support is $ 20,455, $ 20,283 and $ 20071.
Now let's move from the resistance line as you can see the first resistance is $ 20,796, if you can break it the next resistance will be $ 20,956, $ 21081 and $ 21,208.
Looking at the CHOP indicator, we can see that in the 4-hour interval most of the energy has been used, and the MACD indicator shows a local downward trend.
Market Bias & Top Stock Watches - 10/28/2022Bias: Bearish grind.
Top Watches: Long - PINS, INTC, XOM, TMUS, GILD, EQNR, NYCB. Short - AMZN, ZIM, SNOW, ABNB, CRM, EW, BIDU
Follow my page for daily pre-market reviews and trade ideas.

Time for Change?The past two weeks have been another two weeks of low volatility, making October the month with the lowest volatility for some time. However, in the past few days, the upper and lower Bollinger Bands have begun to diverge, implying volatility is starting to pick up. Many active traders will be happy to see a change from the sideways market we have experienced in recent weeks.
From a technical point of view, the bulls will rejoice at the fact that we finally flipped the $20,500 resistance to support and have since retested that level. Bulls will now have their eyes on the $22,800 level which they will be hoping to flip in order to light the way towards $24,000. However, a fall below the $20,500 level would see a return to the range we previously escaped from. The bears will be hoping to see a break below the $18,200 support level which would likely result in new yearly lows. Another important indicator to keep an eye on is the MACD. At present, there is a very small spread between the MACD line and the signal line. If the MACD crosses below the signal line, this would provide support to the idea that we are heading back towards the $18,000-$20,500 range.
In other news, the resignation of UK Prime Minister Liz Truss seems to have restored some confidence in the markets. Consequently, the Pound has gained some serious ground back against the dollar. It now trades at around $1.16, the highest level since the disastrous ‘mini-budget’ was announced. With the newly elected Prime Minister Rishi Sunak having a background in banking and finance, bulls will be hoping he has a firm grasp on the importance of stabilising inflation and the economy. If his government can do this, we could be poised for a more bullish market outlook in the coming months.
Additionally, UK regulators have been urged to ease collateral requirements to avoid a pension-fund blow-up. Market participants will be keeping a close eye on this as the collapse of a large UK pension fund would send shock waves throughout the entire financial system and would signify a bleak short-term outlook for the economy.
Either way, it’s likely that in the coming weeks and months, the outcome of key macro events will dictate the direction of the market. Whether it's a return to up-only or more chaos, things are really starting to heat up.

Intervention injectionMorning folks,
All markets in general and BTC in particular have got a liquidity injections due massive interventions by PBoC, BoJ and SNB in recent 2-3 sessions. This factor intrudes technical picture and has turned it bullish. Still, we think that it is not reliable and could easy go as easy it has come.
Thus, we treat current action as technical pullback. Here we have to watch for two moments. First is nearest upside target is 21.5-21.6K that could be reached. Second - market now stands at resistance. If BTC fails to break it, and returns back in consolidation - do not take long position.

USD pairs testing key daily and weekly areas...USD pairs testing key daily and weekly areas... Some of which are shared in my charts above...
We could see some USD buying...
If the areas break, then perhaps a longer-term USD retrace move
I have been short USDJPY since 1.4930, so hoping for a break lower

If tezos can flip the 50dma 2 support the invh&s should validateNeed to flip this orange 50 daily moving average to solid support and then we can validate the inverse head and shoulder breakout and head to this target. *not financial advice*

Large falling wedge on MATIC over Daily time frame - target 1.05
Retrospective for my own learning and improvement - welcome any criticism
Large Falling wedge on daily timeframe - clear break and re-test of wedge - take profit half around 0.92 (now) and half at 1.05. Then look for deviation and resistance from 1.05 or acceptance for next step.
Where flag icon is there is also a small bull pennant on ltf - target in grey - I expect final price to end up somewhere between those two values.

EURCHF Swing short from weekly zoneWelcome back! Let me know your thoughts in the comments!
**EURCHF - Listen to video!
We recommend that you keep this pair on your watchlist and enter when the entry criteria of your strategy is met.
Please support this idea with a LIKE and COMMENT if you find it useful and Click "Follow" on our profile if you'd like these trade ideas delivered straight to your email in the future.
Thanks for your continued support!
Brian & Kenya Horton, BK Forex Academy
