XAUUSD Daily Projection 25/10/22XAUUSD
XAUUSD is still in the range 1646 - 1657 Loco most likely will try to penetrate the MA100 which is also the resistance today to continue rising. If the resistance is not broken, the temporary uptrend is threatened to end and GOLD may fall again following the big trend. XAUUSD is still in a temporary uptrend with the reversal point at support 1640.
SL PLUS 1649
R3 1678.280
R2 1668.290
R1 1659.600
PV 1646.100
S1 1640.170
S2 1628.440
S3 1616.870
Daily Charts

IndecisionMorning folks,
Market obviously stands indecision. Fundamental background remains bad but technical liquidity support from the Fed and pre-election rally distorts the picture. This lets BTC stands on the surface but at the same time it has not inner power to accelerate higher.
Currently, we do not see any good trading setups, but on longer term charts we keep our bearish view and suggest that downside breakout of daily consolidation in just a question of time. Here, on 1H chart we have triangle consolidation with potential fake upward breakout. The Friday's rally is mostly erased, so, let's keep watching. For intraday trading you could try to catch "222" patterns inside the consolidation on 4H chart. Now we do not have any. Still we think that bears have more chances to succeed...

USDX Hawkish rally starts now?Based on the latest analysis, we can clearly see the trading range of the asset and the support thanks to the Fibonacci and Ichimoku cloud, that's why I believe this will be the beginning of a very strong hawkish rally, even a breakout of the resistance of the current trading range. GOLD will be affected as well, expect an analysis shortly...

We'll seeMorning folks,
So, last setup is started nice - price turns down precisely from 5/8 resistance, keeping chances for potential downside butterfly. Although action looks slow and choppy, fundamental background still stands in favor of downside action. BTC has not taken any part in recent stock market rally, rising US interest yields keep market under pressure. So, let's see... If you have taken short position - now it is possible to move stops to breakeven.

Daily review of BTC interval 4HHello everyone, let's take a look at the BTC to USDT chart over the four hour time frame. As you can see, the price is moving below the local downtrend line.
Let's start with the designation of the support line and as you can see the first support in the near future is nineteen thousand one hundred and six dollars, if the support is broken, the next support is eighteen thousand nine hundred twenty five dollars and eighteen thousand two hundred thirty four dollars.
Now let's move to the line of resistance, as you can see, the first resistance is nineteen thousand two hundred and thirty four dollars, if you can break it, the next resistance will be nineteen thousand three hundred forty five dollars, nineteen thousand four hundred eighty three dollars and nineteen thousand seven hundred twenty seven dollars.
Looking at the CHOP indicator, we can see that in the four-hour interval we have a lot of energy, and the MACD indicator shows a local downward trend.

GBPCAD Short from Resistance to 1.538 Zone Welcome back! Let me know your thoughts in the comments!
**GBPCAD - Listen to video!
We recommend that you keep this pair on your watchlist and enter when the entry criteria of your strategy is met.
Please support this idea with a LIKE and COMMENT if you find it useful and Click "Follow" on our profile if you'd like these trade ideas delivered straight to your email in the future.
Thanks for your continued support!
Brian & Kenya Horton, BK Forex Academy

Daily review of BTC interval 4HHello everyone, let's take a look at the BTC to USDT chart over the 4 hour timeframe. As you can see, the price is moving in the sideways trend channel.
Let's start with the designation of the support, and as you can see, we first have a support zone from nineteen thousand four hundred and forty dollars to nineteen thousand two hundred ninety four dollars, and then we have a second zone from nineteen thousand one hundred eighty four to nineteen thousand fifty five dollars.
Now let's move on to the resistance, and as you can see, the first resistance is from nineteen thousand six hundred and seventy-eight dollars to nineteen thousand eight hundred and ninety-eight dollars, and then we have resistance lines at twenty thousand one hundred and twenty dollars.
Looking at the CHOP indicator, we can see that in the 4-hour interval most of the energy has been used and the MACD indicator shows a local upward trend.

sudden support disappearsMorning folks,
Jump on all markets after CPI report was total shock for market society, at least based on the multiple comments. It has come from Fed minutes that have shown different opinions among the members on the future rate hike's pace. Second, the US banks have sent clear signal to Fed that with this rate pace they could get problems as with earnings as with default provisions.
The bounce on BTC also happened, but it was as strong. We haven't got downside range breakout, but price remains inside the range, and we suggest that downside breakout is a question of time. Since we've got daily bearish grabber, we do not consider long positions by far. Bears, if would like to, could think about position taking around 5/8 19.5K resistance. Potentially downside action could take a shape of the butterfly, with initial target @ 17.6
Invalidation point of this stuff is above 20K top.

Weekly zone ahead. This mapping is to show a very clear structure of support become resistance in daily timeframe.
I marked this zone as "Fresh SBR 6" area probably can become a good zone to re-entry sell.
If you look an opportunity to buy weekly RBS zone is the best area to take a buy risk.
Regards
Alyaqen

NASDAQ 10k soon? 🦐NASDAQ on the daily chart after the last retracement touched the resistance area at the 0.618 Fibonacci level and moved lower to the previous support.
The price looks weak and a lower low to the 10k can be expected.
How can i approach this scenario?
I will wait for a clear break of the 11k zone and in that case, i will be looking for a nice short according to the Plancton's strategy rules.
–––––
Follow the Shrimp 🦐
Keep in mind.
🟣 Purple structure -> Monthly structure.
🔴 Red structure -> Weekly structure.
🔵 Blue structure -> Daily structure.
🟡 Yellow structure -> 4h structure.
⚫️ Black structure -> <4h structure.
Here is the Plancton0618 technical analysis , please comment below if you have any question.
The ENTRY in the market will be taken only if the condition of the Plancton0618 strategy will trigger.

16.5K?Morning folks,
Overall situation on financial markets is far from positive. UK Bond market has collapsed and nobody knows what end will it have. J. Yellen speaks on liquidity shorts on Treasury Bills market. PPI was two times greater than expected yesterday. With such environment, whatever CPI we will get today, hardly it will reverse BTC market up.
Thus, we do not consider long position now. Since market has failed to break consolidation up - most logical way is to attempt to break it down. If it will be successful, BTC could reach 16.5K level. We do not see any bearish continuation patterns inside the range. So you could wait for them, or use Stop "Sell" entry order near the low border of consolidation. If you want to sell of course.

NZDJPY Headed Upward +250 Pip PotentialWelcome back! Let me know your thoughts in the comments!
**NZDJPY - Listen to video!
We recommend that you keep this pair on your watchlist and enter when the entry criteria of your strategy is met.
Please support this idea with a LIKE and COMMENT if you find it useful and Click "Follow" on our profile if you'd like these trade ideas delivered straight to your email in the future.
Thanks for your continued support!
Brian & Kenya Horton, BK Forex Academy

Chzusdt Simple Analys Hey this is my first post and I hope you guys love this analysis....if you want any coin analyses...you can ccomment.

EURCHF Local buy opportunity! Step by step breakdownWelcome back! Let me know your thoughts in the comments!
**EURCHF - Listen to video!
We recommend that you keep this pair on your watchlist and enter when the entry criteria of your strategy is met.
Please support this idea with a LIKE and COMMENT if you find it useful and Click "Follow" on our profile if you'd like these trade ideas delivered straight to your email in the future.
Thanks for your continued support!
Brian & Kenya Horton, BK Forex Academy

19.70-19.75 looks nice for shortMorning folks,
Recent NFP data and following hawkish comments from Fed members give small chances to stock and BTC markets to show any kind of upside performance. Fed last week finally seriously started QT and cut the balance for $200 Bln, drying more liquidity out of the market. This week we also expect the bumpy ride with CPI, Fed minutes and retail sales releases.
Thus, in current circumstances, as BTC has failed to complete even minor upside target last week, we suggest that 1H chart 19.70-19.75 resistance might be considered for short entry with potential downside continuation back to daily lows. If, of course, this upside bounce happens at all...

EURUSD ShortFX:EURUSD
EURUSD potential short. Should price break support, await a retest and go short.
Price had previously broken bullish structure.

Daily review of BTC interval 4HHello everyone, let's take a look at the BTC to USDT chart over the 4 hour timeframe. As you can see, the price is moving below the local uptrend line.
Let's start with the designation of the support line and as you can see the first support in the near future is $ 19,386, if the support breaks down, the next support is $ 19,226 and $ 19,090.
Now let's move from the resistance line, as you can see, the first resistance is $ 19,496, if you can break it, the next resistance will be $ 19,601, $ 19,678 and $ 19,763.
Looking at the CHOP indicator, we can see that in the 4-hour interval the energy has been used, and the MACD indicator indicates a local downward trend.

⚡️ #DAR/USDT - Potential 463% - Long - Daily ⚡️⚡️ #DAR/USDT - Potential 463% - Long - Daily ⚡️
All targets & analysis displayed on chart
Entry Conditions:
- Oversold
- BPT Wave Reversal
- Bullish Divergence
- Descending Wedge
- BPT Buy Signal

⚡️ #ADA/USDT - Potential 394% - Long - Daily ⚡️⚡️ #ADA/USDT - Potential 394% - Long - Daily ⚡️
All targets & analysis displayed on chart
Entry Conditions:
- End of consolidation - large breakout expected
- Oversold
- BPT Wave Reversal
- Bullish Divergence

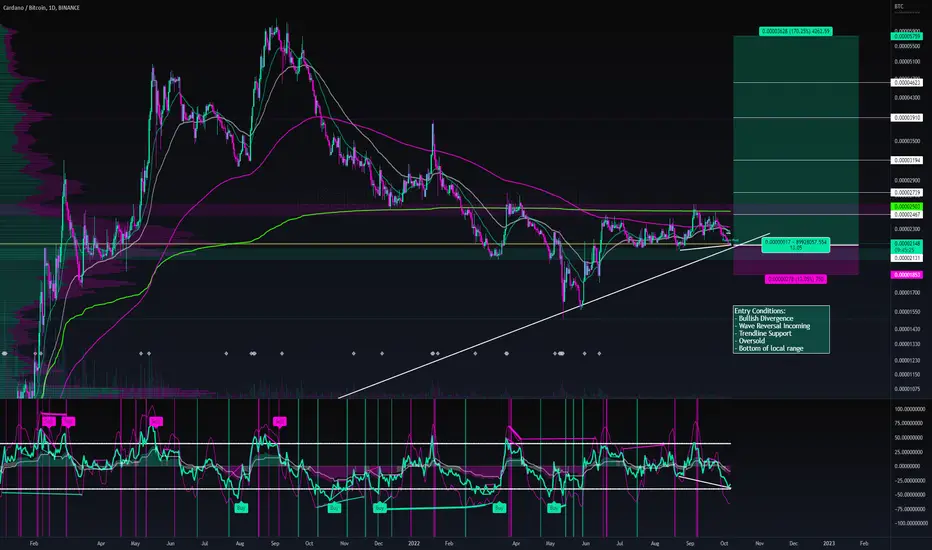
⚡️ #ADA/BTC - Potential 170% - Long - Daily ⚡️⚡️ #ADA/BTC - Potential 298% - Long - Daily ⚡️
All targets & analysis displayed on chart
Entry Conditions:
- Bullish Divergence
- Wave Reversal Incoming
- Trendline Support
- Oversold
- Bottom of local range
BTC puts in a Daily Adam and Eve bottomBitcoin is putting in a daily Adam and Eve bottom. Likely will be a volatile 2 years before the next halving rather than a dull one as bitcoin's relative hardness next halvening exceeds gold.

20.6-21K seems OK for shortMorning folks,
Fed has opened liquidity box, trying to calm down markets, households before US elections, and making the image that everything is becoming well, situation is normalizing, markets start rising. This is short-term performance for just 3-4 weeks, until elections take place. Then, everything should collapse.
Anyway, within these weeks, BTC could climb slightly higher, following other markets, although BTC lags solidly behind stock market performance by far. In very short-term (tod-tom) we consider 20.6-21K resistance area as interesting for taking short position. we could get "222" Sell precisely at the trendline resistance. Besides, we have multiple targets on intraday chart in this area. Thus, downside bounce, especially if NFP will be more or less positive, is possible.

volatility still horror pic in the makingthe fed isnt interested in saving the market. it only cares that it delays the maximum selling until late in the year. they want choppy action because this allows them to scare retail out and institutions can scale horizontally. were likely to hit signal, sss ma, trama and rebound. uvxy is a sell if we get to top of envelope or we break pivot and continue lower. its still a buy around green signal.
